matplotlib.pyplot.gca() means “get current Axes.” It returns the active Axes object so you can call methods such as set_title(), set_xlabel(), or plot() on the current plotting area.
Quick Answer
Use plt.gca() when pyplot has already established the active plotting state and you need that Axes object. For new code, prefer fig, ax = plt.subplots() so the axes you intend to modify is explicit.
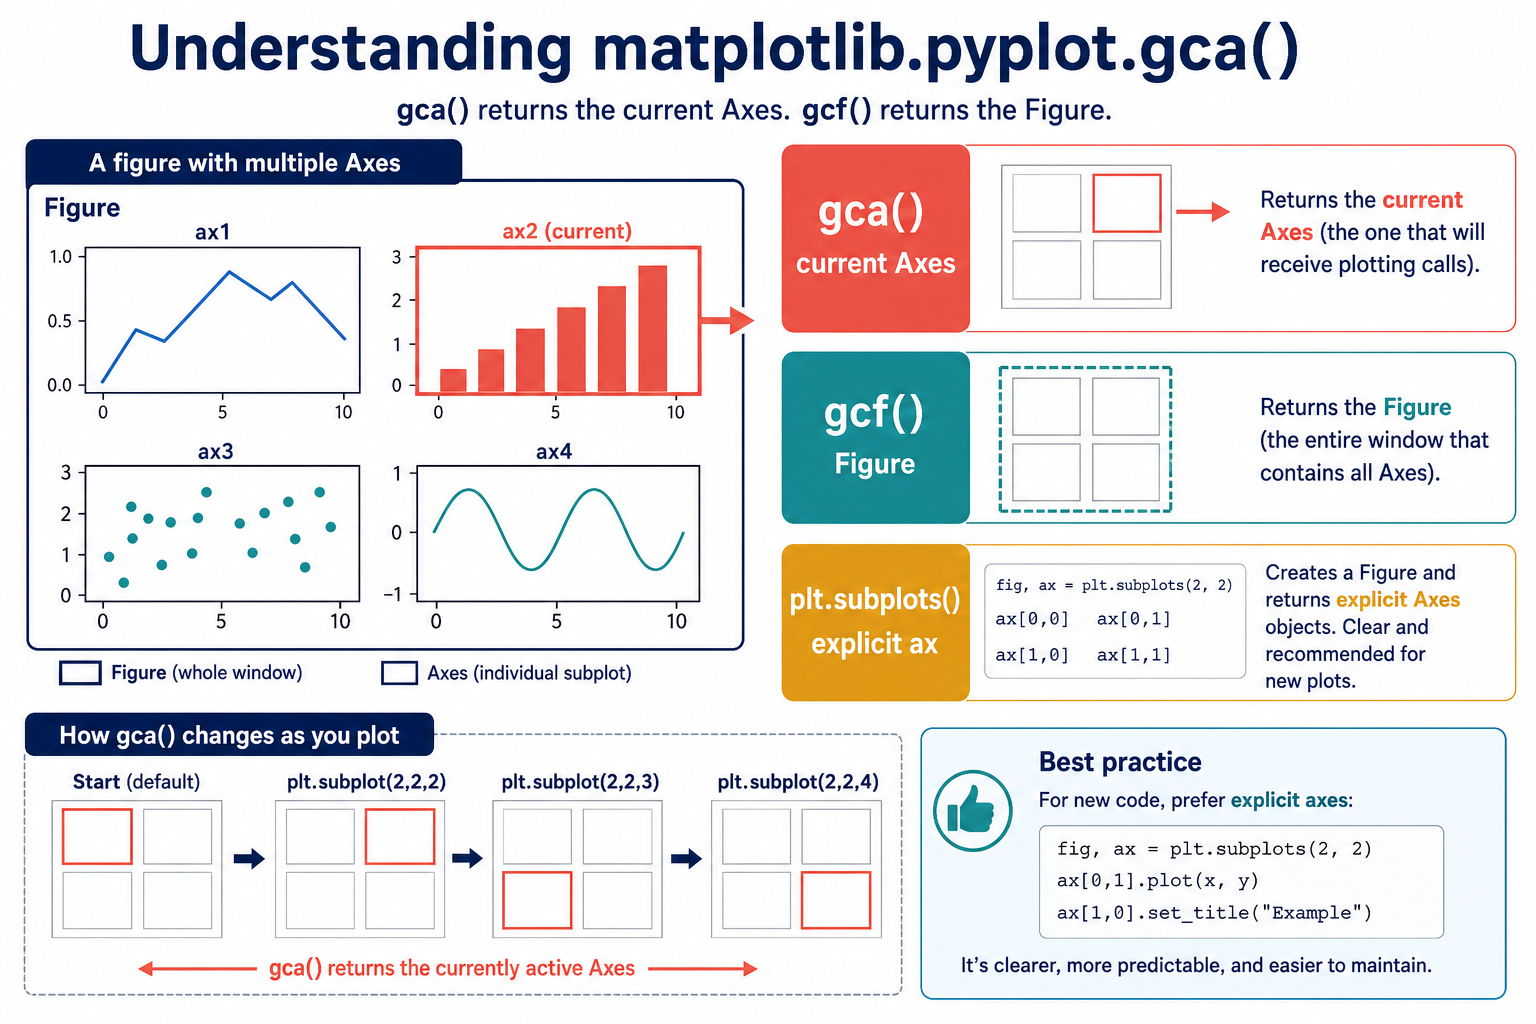
The official gca() reference says that it gets the current Axes and creates one if the current Figure has none. The related gcf() reference covers the current Figure, while subplots() documents the explicit creation pattern.
Basic gca() Example
After a pyplot plotting call, gca() gives you the Axes that pyplot considers active.
import matplotlib.pyplot as plt

plt.plot([1, 2, 3], [2, 4, 6])
ax = plt.gca()
ax.set_title('Current Axes')
plt.show()
The returned object is an Axes, not the Figure. Axes methods control labels, limits, artists, grids, and data inside that plotting area.
gca() Creates An Axes When Needed
If a Figure exists but has no Axes, calling gca() creates a default one.
import matplotlib.pyplot as plt

fig = plt.figure()
print(len(fig.axes))
ax = plt.gca()
print(len(fig.axes))
This behavior is convenient for interactive exploration, but it can be surprising in library code. A function that calls gca() may create a new axes as a side effect when the caller did not expect one.
Prefer Explicit subplots() For New Figures
The object-oriented pattern returns both the Figure and Axes handles in one statement.
import matplotlib.pyplot as plt

fig, ax = plt.subplots()
ax.plot([1, 2, 3], [2, 4, 6])
ax.set_title('Explicit Axes')
plt.show()
Explicit axes are easier to test and compose. They also avoid hidden dependencies on whichever figure or subplot happened to be active before a function ran.
gca() With Multiple Subplots
With more than one axes, the current object depends on the pyplot state. If code changes the active subplot, a later gca() call may return a different object than the reader expects.
import matplotlib.pyplot as plt

fig, (ax1, ax2) = plt.subplots(1, 2)
ax1.plot([1, 2], [1, 4])
ax2.plot([1, 2], [2, 3])
plt.sca(ax2)
current = plt.gca()
current.set_title('Active Axes')
plt.show()
Keep named variables such as ax1 and ax2 for maintainable multi-panel figures. Use stateful selection only when the interactive workflow genuinely benefits from it.
gca() Versus gcf()
The distinction is simple:
| Function | Returns | Use it for |
|---|---|---|
plt.gca() |
Current Axes | Axes-level plotting and labels |
plt.gcf() |
Current Figure | Figure-level size, saving, and layout |
A Figure can contain several Axes. Getting the Figure does not tell you which subplot should receive the next plotting call; getting the Axes does.
3D Axes And Other Projections
For a 3D chart or a specialized projection, create the Axes explicitly with subplot_kw or add_subplot(). This makes the projection part of the construction step.
import matplotlib.pyplot as plt

fig, ax = plt.subplots(subplot_kw={'projection': '3d'})
ax.set_title('Explicit 3D Axes')
plt.show()
The same principle applies to grids, polar charts, twin axes, and inset axes: keep the object returned by the creation call and use its methods directly.
When gca() Is A Good Fit
- Interactive exploration in a notebook or Python console.
- A small script that has one clearly active axes.
- Adapting a pyplot-based example that already owns the plotting state.
Use explicit axes for reusable functions, tests, dashboards, and figures with multiple panels. The related Matplotlib gridspec guide and subplot spacing guide are useful when layout becomes more involved.
Common gca() Mistakes
- Confusing an Axes object with its containing Figure.
- Calling gca() after changing subplot state and modifying the wrong panel.
- Relying on implicit axes in a reusable function.
- Creating an axes accidentally while only trying to inspect state.
The practical rule is to use gca() when you truly want the current state and use explicit ax variables when you want predictable code. That small distinction prevents many multi-panel plotting bugs.
Stateful pyplot Versus Object-Oriented Axes
Pyplot is convenient because it maintains a current Figure and current Axes for interactive commands. That state is also implicit: a later call can change the active object without changing the variable in your head. The object-oriented API makes the relationship visible in the function arguments and local variables.
For a reusable plotting function, accept an Axes or create one explicitly and return it. This lets callers decide where the plot belongs and makes unit tests independent of a global pyplot session.
Figure Size, Saving, And Layout
Use the Figure returned by plt.subplots() for figure-level work such as fig.set_size_inches(), fig.savefig(), and layout configuration. Use the Axes for data, labels, limits, and artists.
Calling gca() does not solve layout by itself. When a figure has several axes, configure spacing with the figure’s layout tools and then inspect the saved output. A plot that looks correct in an interactive window can still clip labels when exported.
Axes Lifecycle And Cleanup
In scripts that create many figures, close figures that are no longer needed. Otherwise the global pyplot state can keep objects alive and make a later gca() call refer to a different figure than expected.
Use plt.close(fig) when the Figure handle is available. Keeping the handle is another reason explicit construction is safer than relying on an implicit current object.
Testing A Plotting Helper
A plotting helper is easier to test when it returns an Axes or Figure instead of only calling plt.show(). A test can inspect titles, labels, number of lines, and axis limits without depending on a graphical display.
Use a non-interactive backend in automated environments when needed, and save a small test image for visual regression checks. The important invariant is the intended Axes, not whichever one happened to be current before the test started.
Use gca() As A Bridge, Not A Hidden Dependency
Existing pyplot examples often use gca() correctly because the active Axes is part of the example’s state. When moving that code into a library, replace the hidden lookup with an explicit Axes parameter or a fig, ax = plt.subplots() construction step.
Frequently Asked Questions
What does matplotlib.pyplot.gca() return?
gca() returns the current Axes object. If the current Figure has no axes, Matplotlib creates an axes and returns it.
What is the difference between gca() and gcf()?
gca() returns the current Axes, which is an individual plotting area. gcf() returns the current Figure, which contains one or more Axes.
Why is plt.subplots() usually preferred?
plt.subplots() creates the Figure and explicit Axes variables together, which is clearer and more predictable when a figure has multiple subplots.
How do I choose the current axes?
Keep explicit ax variables whenever possible. In stateful pyplot code, operations such as subplot selection can change which Axes gca() returns.
