
Quick answer: Use np.mean(values) for the arithmetic mean, then choose axis, dtype, keepdims, where, and missing-value behavior from the shape and precision your calculation requires.
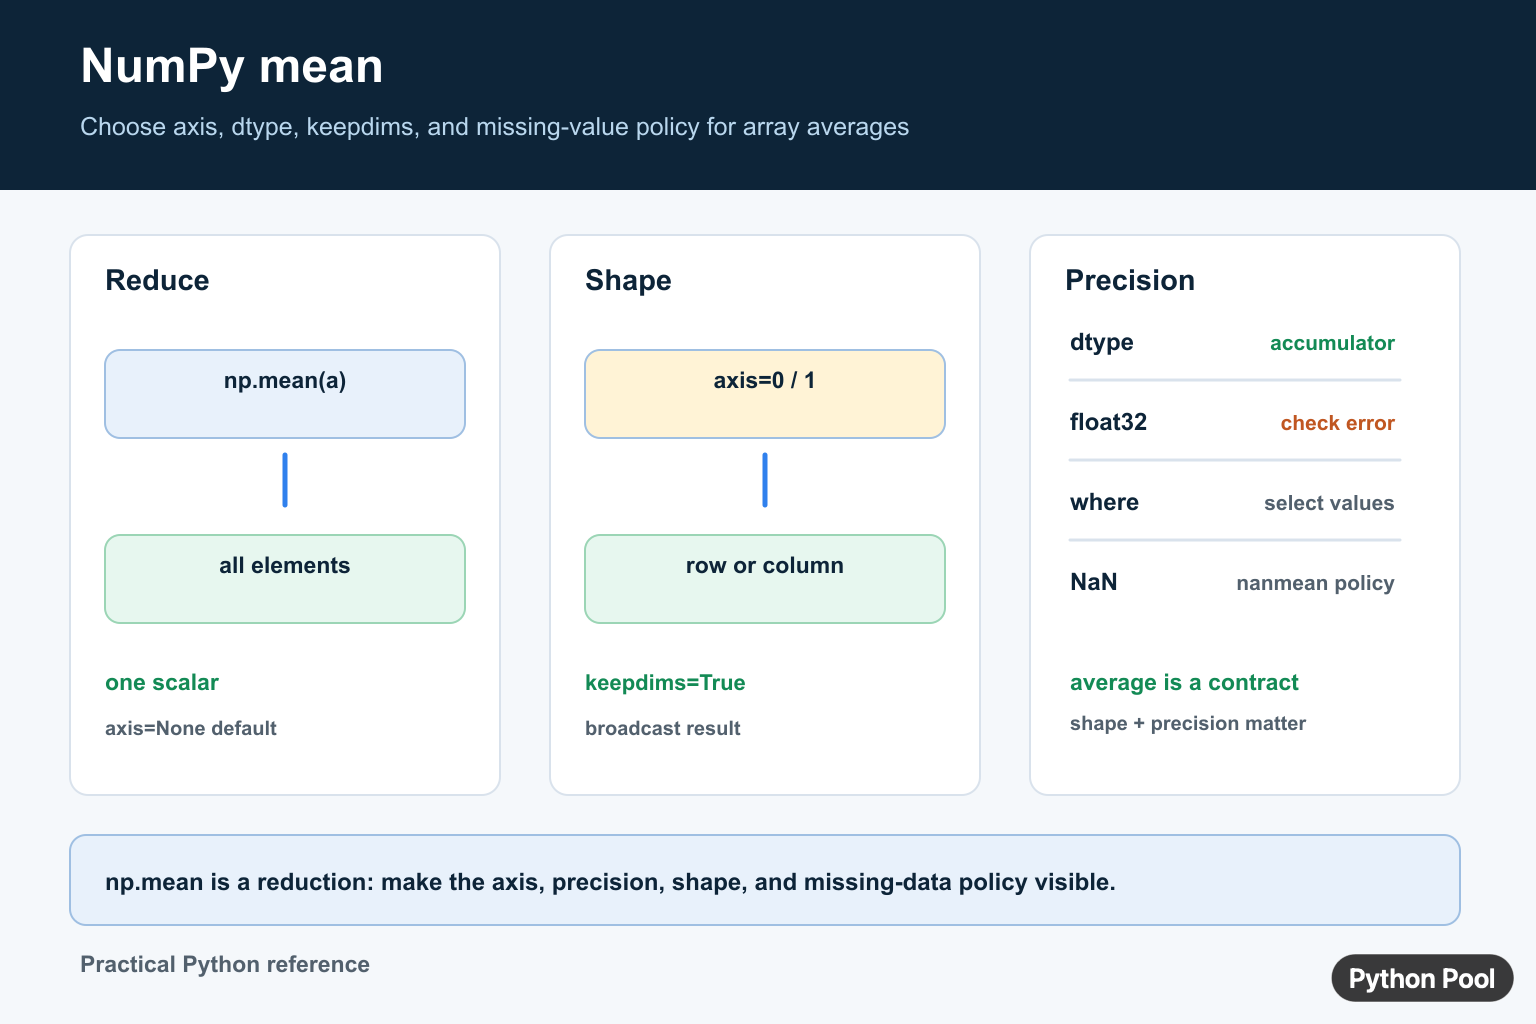
numpy.mean() calculates the arithmetic average of array values. It adds values together and divides by the count.
The official NumPy documentation covers numpy.mean(), numpy.nanmean(), and numpy.average().
The mean is useful for summaries, scores, measurements, feature engineering, and quick checks of numeric arrays. It is sensitive to extreme values, so compare it with the median when the data is skewed.
The main option is axis. Without an axis, NumPy flattens the array and returns one average. With an axis, it calculates averages across rows or columns.
Also pay attention to dtype. Integer inputs can still produce floating-point output, and large integer sums may need a wider dtype for safer accumulation.
Before using the mean in a report, ask whether every value should have equal influence. If some values should count more than others, use a weighted average instead of np.mean().
It is also helpful to compare the mean with the median during exploration. If those summaries are far apart, the data may contain skew, outliers, or groups that should be analyzed separately.
Calculate A Basic Mean
Pass an array to np.mean() to calculate one average.
import numpy as np

scores = np.array([10, 20, 30, 40])

result = np.mean(scores)

print(result)
This prints 25.0.
The result is a float because the arithmetic average may not be an integer.
Use this form for one-dimensional scores, measurements, counts, or quick summary checks.
For readability, keep the input array name meaningful in real code. A mean is only useful when the reader knows what was averaged.
Mean Down Columns
Use axis=0 to calculate the mean down each column.
import numpy as np

data = np.array([
    [10, 80],
    [20, 85],
    [30, 90],
])

result = np.mean(data, axis=0)

print(result)
Each column receives its own average.
This is useful when columns represent separate metrics, features, or measurements.
Column means are common in table summaries and preprocessing steps before modeling.
When columns have different units, keep their means separate. Combining all values into one flattened mean would mix unrelated measurements and usually produce a number with no clear meaning.
Mean Across Rows
Use axis=1 to calculate an average for each row.
import numpy as np

data = np.array([
    [10, 20, 30],
    [40, 50, 60],
])

result = np.mean(data, axis=1)

print(result)
Each row receives its own average.
This is useful when each row is one record and the columns are repeated measurements for that record.
Check the shape before selecting an axis. A wrong axis can return valid numbers that summarize the wrong direction.
For an array shaped like (rows, columns), axis=0 summarizes each column and axis=1 summarizes each row. That rule is worth checking before publishing a result.
Set dtype For Accumulation
The dtype argument controls the type used during the calculation.
import numpy as np

data = np.array([1, 2, 3], dtype=np.int16)

result = np.mean(data, dtype=np.float64)

print(result)
print(type(result).__name__)
A wider dtype can help when integer inputs are large or when precision matters.
For ordinary small arrays, the default is usually fine. For production numeric pipelines, choose dtype deliberately and test boundary cases.
This is especially important when values are accumulated many times or when the input dtype is narrow.
Keep Dimensions
Use keepdims=True when the reduced axis should remain with size one.
import numpy as np

data = np.array([
    [10, 20, 30],
    [40, 50, 60],
])

result = np.mean(data, axis=1, keepdims=True)

print(result)
print(result.shape)
This is useful for later broadcasting operations.
For example, keeping dimensions can make it easier to subtract each row mean from the original row values.
For simple printed summaries, the default one-dimensional result is often easier to read.
Ignore NaN Values
Use np.nanmean() when missing values are represented by nan and should be skipped.
import numpy as np

data = np.array([10, 20, np.nan, 40])

result = np.nanmean(data)

print(result)
This calculates the mean from the non-NaN values.
Only skip missing values when that is the correct rule for the dataset. Sometimes missing values should be rejected, filled, or reported separately before summary statistics are calculated.
Document the choice so another person can reproduce the same result later.
Common mean Mistakes
The first common mistake is forgetting that the mean is sensitive to extreme values. A few large values can move the average far away from the typical value.
The second mistake is omitting axis when row or column summaries are needed. Flattened averages, row averages, and column averages answer different questions.
The third mistake is using np.mean() when weighted averages are required. Use np.average() with weights for that case.
Another issue is integer overflow in narrow input types. If inputs are large or stored in a small dtype, set a wider dtype and test the result.
In short, use np.mean(data) for one average, choose an axis for row or column summaries, set dtype when precision matters, and use np.nanmean() only when missing values should be ignored. Mean is sensitive to outliers; NumPy median: Calculate Array Medians explains the median alternative, axes, even-length samples, and NaN-aware choices.
Choose The Reduction Axis
With no axis, np.mean() reduces every element to one value. Set axis=0 or axis=1 to reduce along a specific dimension, or pass a tuple of axes for a multidimensional reduction. keepdims=True leaves reduced axes at size one so the result can broadcast against the original array.
import numpy as np

values = np.array([[1, 2], [3, 4]])
print(np.mean(values))
print(np.mean(values, axis=0))
print(np.mean(values, axis=1, keepdims=True))
Make Precision Explicit
Integer inputs use floating-point accumulation by default. Floating-point means use the input precision, which can matter for large or noisy float32 arrays. Pass dtype=np.float64 when the additional precision is worth the memory and runtime cost. Use np.nanmean() only when ignoring NaN values is the intended data policy.
The where argument can select which values participate in a mean, but an all-false selection still needs an empty-input policy. Treat warnings, NaN results, and masked data as signals to document rather than silently suppress.
Frequently Asked Questions
How do I calculate a mean with NumPy?
Call np.mean(array) for the arithmetic mean, or pass axis, dtype, keepdims, and where when the default reduction is not the intended contract.
What does axis do in np.mean()?
axis selects the dimension or dimensions to reduce; axis=None reduces all elements to one scalar.
How do I preserve dimensions after calculating a mean?
Pass keepdims=True so reduced axes remain size one and the result can broadcast against the original array.
Should I use mean or nanmean?
Use np.nanmean() only when ignoring NaN values is the intended data policy; otherwise keep NaN propagation visible.
