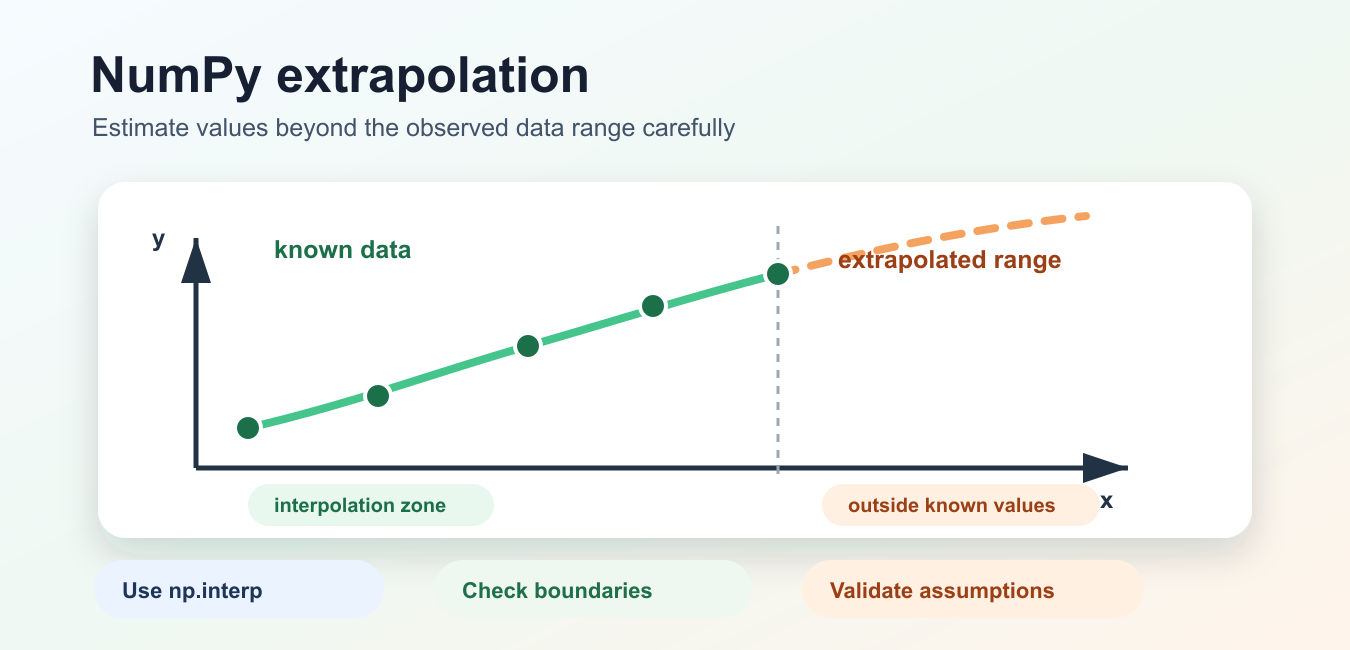
Quick answer: Extrapolation estimates values beyond the observed x range, so it depends on an assumption about how the pattern continues. Expose the boundary and model, validate against held-out edge data, measure distance beyond observations, and report uncertainty rather than presenting a projection as a measurement.
Extrapolation means estimating values outside the range of known data. If your x values run from 0 to 10, predicting a value at 12 is extrapolation. NumPy does not have a single function named extrapolate, but you can build simple extrapolation with numpy.interp, linear formulas, or fitted models.
The risk is that extrapolation assumes the pattern continues beyond the observed range. That assumption can be wrong. Use it for controlled estimates, short projections, and data checks, but avoid treating extrapolated results as measured facts. If the task is just changing array layout before modeling, use a shape tool such as NumPy reshape or NumPy ravel instead.
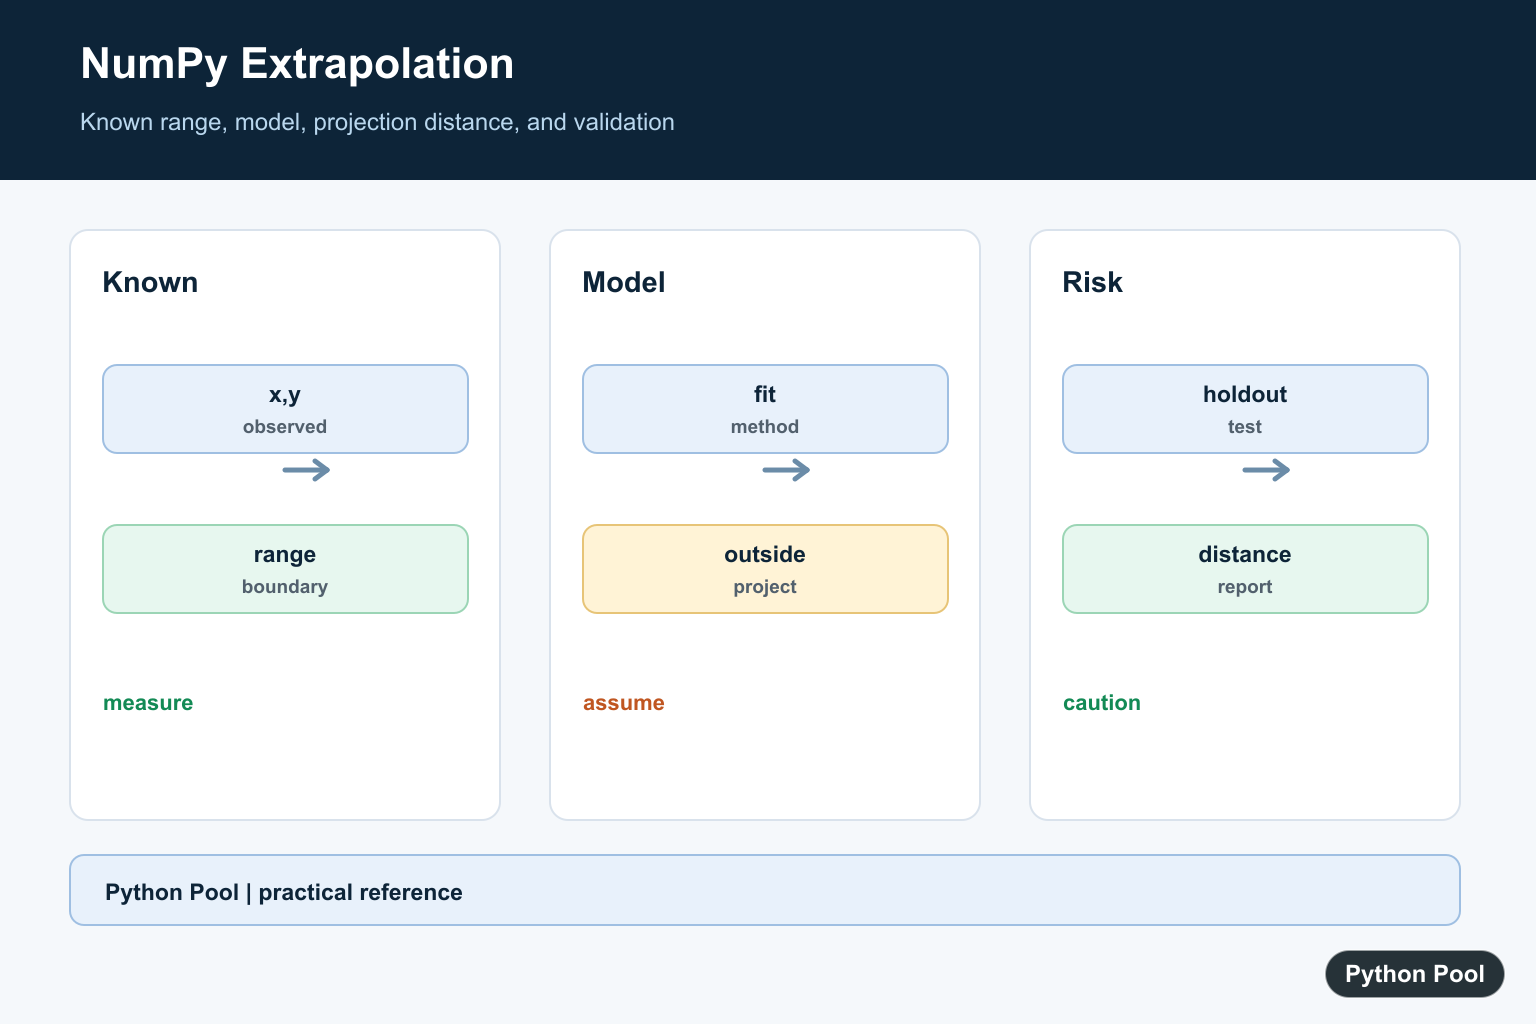
A good extrapolation workflow keeps three things visible: the known x range, the method used to project beyond that range, and the distance from the nearest measured point. The farther away the requested point is, the more cautious the interpretation should be.
Start With Interpolation
np.interp is mainly an interpolation helper. Inside the known x range, it estimates values between existing points.
import numpy as np

x = np.array([0, 2, 4, 6])
y = np.array([0, 4, 8, 12])

estimate = np.interp(3, x, y)
print(estimate)
This estimates the value at x=3, which is between known points. That is interpolation, not extrapolation, and it is usually safer because the estimate stays inside the observed data range.
Use interpolation first when the requested point is inside the data. It is simpler to defend because the estimate is based on neighboring measurements rather than an assumed future trend.
Understand np.interp Boundaries
By default, np.interp does not extend the line beyond the data. Values to the left or right of the known range return boundary values unless you provide left or right.
import numpy as np

x = np.array([0, 2, 4])
y = np.array([0, 10, 20])
points = np.array([-1, 1, 5])

print(np.interp(points, x, y))
print(np.interp(points, x, y, left=-99, right=99))
This behavior is useful when you want to cap estimates at known limits. If you need a true projection beyond the last point, write that logic explicitly so the assumption is visible.
Boundary values are often the right choice for dashboards and alerts where estimates outside the data range should not drift. They are not the same as extending a trend line.
Linear Extrapolation From End Points
A simple linear extrapolation can use the slope from the last two points. This is reasonable only when a straight-line trend near the boundary is a defensible assumption.
import numpy as np


def linear_extrapolate(x, y, point):
    slope = (y[-1] - y[-2]) / (x[-1] - x[-2])
    return y[-1] + slope * (point - x[-1])


x = np.array([0, 2, 4, 6])
y = np.array([0, 3, 7, 12])
print(linear_extrapolate(x, y, 8))
This uses the final segment of the data to project forward. For the left side, use the first two points instead. Keep the function small and tested because extrapolation bugs can look plausible.
This approach is transparent because the slope is easy to inspect. It is also limited: a single final segment may not represent the whole process, especially with noisy or curved data.
Extrapolate With polyfit
For a polynomial trend, fit a curve with np.polyfit and evaluate it outside the known range. This can be useful, but higher-degree polynomials can behave badly outside the data.
import numpy as np

x = np.array([0, 1, 2, 3, 4])
y = np.array([1, 2, 5, 10, 17])

coefficients = np.polyfit(x, y, deg=2)
model = np.poly1d(coefficients)
print(model(5))
Use the lowest-degree model that makes sense for the data. For more detail on fitting with NumPy, see the NumPy polyfit guide. For count and bin checks before fitting, see the NumPy histogram guide.
Polynomial extrapolation should be reviewed carefully. A model can fit the known points well and still grow too quickly outside the measured range.
Use SciPy When You Need A Tool
When SciPy is available, scipy.interpolate.interp1d can be configured with fill_value="extrapolate". This makes the extrapolation setting explicit.
import numpy as np
from scipy.interpolate import interp1d

x = np.array([0, 1, 2, 3])
y = np.array([0, 1, 4, 9])

model = interp1d(x, y, fill_value="extrapolate")
print(model(4))
SciPy also offers tools such as CubicSpline. More flexible tools still need judgment: the farther you move from observed data, the less reliable the estimate usually becomes.
Use SciPy when you need a reusable interpolation object or more control over behavior outside the domain. Keep comments near the code that explain why extrapolation is acceptable for the dataset.
Add Range Checks
A helper that warns when a requested point is outside the known range can prevent accidental extrapolation. This is useful in reports, dashboards, and data pipelines.
import numpy as np


def is_outside_range(x, point):
    x = np.asarray(x)
    return point < x.min() or point > x.max()


x = np.array([10, 20, 30])
print(is_outside_range(x, 35))
print(is_outside_range(x, 25))
The safest workflow is to separate interpolation from extrapolation, mark extrapolated values clearly, and validate the result against domain knowledge. Short, transparent estimates are easier to review than hidden projections inside larger code.
In reports, label extrapolated numbers and show the known data range beside them. That small bit of context prevents readers from confusing predictions with observations.
Separate Interpolation And Extrapolation
Interpolation estimates between known points and is usually less speculative. A request outside the minimum or maximum observed x value is extrapolation and needs a deliberate outside-range policy.
Choose A Model
A linear formula may be reasonable over a short, stable interval, while polynomial or domain-specific models make different assumptions. Do not use a more complex model without evidence that it improves the boundary behavior.
Validate The Boundary
Hold out known points near the edge, fit on the remaining observations, and compare predictions with the held-out values. Validation inside the data range does not prove that an outside-range projection is reliable.
Control numpy.interp Behavior
numpy.interp is primarily an interpolation function and its left and right outside-range values must be understood before it is used around a boundary. A constant extension is not the same as a fitted extrapolation.
Report Distance And Risk
The farther a requested x is beyond the nearest observation, the more sensitive the result may be to model choice and noise. Return a confidence indicator or refuse the estimate when the distance exceeds a domain limit.
The NumPy interp reference documents interpolation and outside-range parameters. Related references include variance and uncertainty, array shape handling, and validation tests.
For related numerical modeling, compare uncertainty, array shapes, and validation tests when estimating beyond observations.
Frequently Asked Questions
Does NumPy have an extrapolate function?
No single NumPy function handles every extrapolation problem; choose a formula, fitted model, or interpolation tool with an explicit boundary policy.
Why is extrapolation risky?
It assumes the observed relationship continues outside the measured range, where the true behavior may change or become unstable.
Can numpy.interp extrapolate?
numpy.interp is primarily an interpolation helper and its outside-range behavior must be checked and controlled rather than assumed to be a fitted extrapolation.
How should I validate an extrapolation?
Hold out known boundary data, compare methods, report distance beyond observations, and include uncertainty or a refusal rule when confidence is weak.
