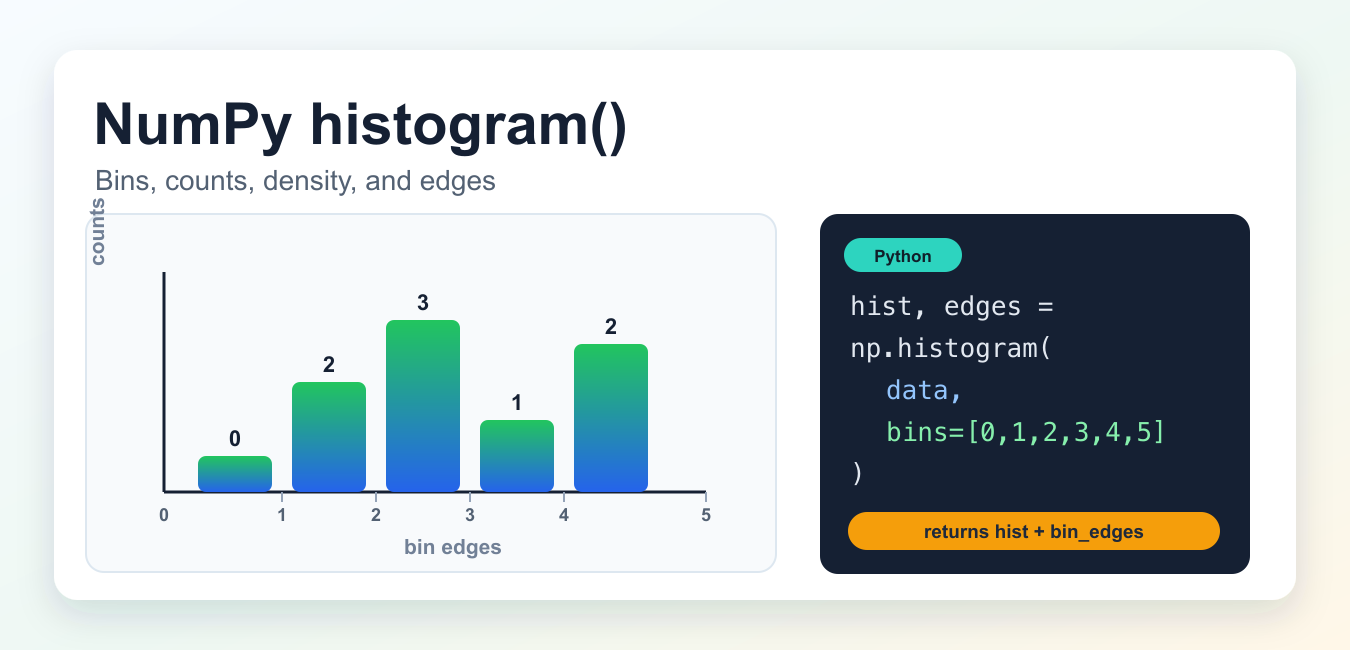
Quick answer: numpy.histogram() turns numeric data into intervals and values that summarize how observations are distributed. It returns counts and bin edges, not a plot. Decide whether you need counts, a density estimate, or weighted observations, and treat the returned edges as the source of truth for interpreting each interval.
numpy.histogram() turns raw numeric values into bin counts. It does not draw a chart by itself; it returns the numbers you need for a histogram: hist and bin_edges. Use it when you want the computed counts, density values, or bin edges before plotting or passing the result into another workflow. histogram() counts values per bin, while NumPy digitize: Bin Values in Python returns the bin index assigned to each input value.
What np.histogram() returns
The function flattens the input data, places each value into a bin, and returns two arrays. hist contains one value per bin. bin_edges contains the edges of those bins, so it is always one item longer than hist.
import numpy as np

data = np.array([1, 2, 1, 3, 4, 2, 2])
hist, bin_edges = np.histogram(data, bins=[0, 1, 2, 3, 4, 5])

print(hist)       # [0 2 3 1 1]
print(bin_edges)  # [0 1 2 3 4 5]
With these edges, the bins are [0, 1), [1, 2), [2, 3), [3, 4), and [4, 5]. NumPy treats all bins as half-open except the last bin, which includes the right edge.
Syntax
hist, bin_edges = np.histogram(a, bins=10, range=None, density=False, weights=None)
The a argument is your input data. bins can be an integer, a sequence of explicit bin edges, or a string such as "auto" for automatic bin selection.
hist, edges = np.histogram(data, bins="auto")
Use range=(low, high) to force the lower and upper bin limits. Values outside that range are ignored. This is useful when you want comparable histograms across multiple arrays.
Choosing bins and ranges
Start with explicit bin edges when the boundaries matter to your analysis. For example, a grading scale, price band, age group, or image intensity range usually needs fixed edges so the counts are easy to compare. Use an integer such as bins=20 when you only need evenly spaced buckets across the data range.
Automatic bin methods such as bins="auto" are convenient during exploration, but they can change when the input data changes. If you are publishing a report or comparing multiple arrays, fixed edges plus a fixed range usually make the result easier to reproduce.
Density and weights
By default, np.histogram() returns counts. Set density=True when you want probability density values instead of raw counts.
hist, edges = np.histogram(data, bins=[0, 1, 2, 3, 4, 5], density=True)
Density output is not the same thing as probability counts unless every bin has width 1. For a density histogram, the area under the histogram is normalized to 1.
The weights parameter lets each input value contribute a custom amount instead of 1. The weights array must match the shape of the input array.
weights = np.array([1, 1, 2, 1, 1, 1, 3])
hist, edges = np.histogram(data, bins=[0, 1, 2, 3, 4, 5], weights=weights)
np.histogram() vs plt.hist()
Use np.histogram() when you need the numbers. Use matplotlib.pyplot.hist() when you want to draw the chart. Matplotlib’s plt.hist() computes and plots a histogram, returns n, bins, and patches, and forwards bin-related arguments to NumPy’s histogram implementation. Once bin edges and counts are correct, Fix Seaborn histplot AttributeError fixes Seaborn environments where histplot is missing because the installed version is too old or shadowed.
import matplotlib.pyplot as plt

counts, bins, patches = plt.hist(data, bins=[0, 1, 2, 3, 4, 5])
plt.show()
If you already computed the counts with NumPy, plot the precomputed result instead of recalculating it. For larger visual grids, see our guide to Matplotlib pcolormesh.
2D histograms
For two variables, use np.histogram2d(). It returns the histogram array plus the x and y bin edges.
x = np.array([0.1, 0.4, 1.2, 1.8])
y = np.array([1.0, 1.5, 0.7, 1.8])

H, xedges, yedges = np.histogram2d(x, y, bins=2)
When visualizing a 2D histogram, remember that NumPy stores x along the first array dimension and y along the second dimension. Transpose the result when a plotting function expects normal Cartesian orientation.
Common mistakes
- Expecting
np.histogram()to draw a plot. It returns arrays; use Matplotlib when you need a figure. - Copying older examples that use obsolete
normedarguments. Usedensityinstead. - Treating
density=Trueoutput as simple probabilities. Density is normalized by bin width. - Forgetting that the final bin includes its right edge.
- Using
rangewithout realizing out-of-range values are skipped.
Related NumPy guides
Official references
- NumPy documentation for numpy.histogram
- NumPy documentation for numpy.histogram2d
- Matplotlib documentation for pyplot.hist
Read Counts And Edges Together
The counts array has one fewer item than the edges array because each count belongs to the interval between two adjacent edges. The first bin includes its left edge and the final bin includes its right edge. Keep both arrays when labeling or validating a distribution.
import numpy as np

values = np.array([0.2, 0.8, 1.1, 1.9, 2.2])
counts, edges = np.histogram(values, bins=3)
print(counts)
print(edges)
print(len(counts), len(edges))
Choose Bins And Range Explicitly
An integer creates equal-width bins across the selected range, while an explicit sequence gives you domain-specific boundaries. Supplying range can exclude values outside the interval from the calculation, so record that policy instead of treating the result as a summary of every input value.
values = np.array([1, 2, 3, 8, 9])
counts, edges = np.histogram(values, bins=[0, 5, 10])
print(counts)
print(edges)
Understand density=True
density=True scales the bin heights so the sum of height times bin width is approximately one. For unequal bin widths, a height is not the probability of the bin by itself. Multiply by the corresponding width when interpreting probability mass, and do not call density values raw counts.
values = np.array([0.2, 0.8, 1.1, 1.9, 2.2])
counts, edges = np.histogram(values, bins=[0, 1, 3], density=True)
widths = np.diff(edges)
print(counts)
print((counts * widths).sum())
Use Weights And Plot Carefully
weights replace each observation’s contribution with a supplied value. This is useful for exposure, frequency, or importance data, but it changes the meaning of the result. If you draw bars, use edges to compute widths and align the bars with the same bins used for the numeric summary.
weights = np.array([1.0, 2.0, 1.0, 3.0, 2.0])
counts, edges = np.histogram(values, bins=3, weights=weights)
centers = (edges[:-1] + edges[1:]) / 2
widths = np.diff(edges)
print(list(zip(centers, counts, widths)))
NumPy’s official histogram() reference defines bins, range, density, weights, counts, and edges. Keep the numerical result separate from plotting so the chart cannot hide an incorrect bin interpretation.
For related distribution workflows, compare Matplotlib 2D histograms, Seaborn histplot troubleshooting, and NumPy normal samples when choosing bins and interpreting density.
Frequently Asked Questions
What does NumPy histogram() return?
It returns an array of bin counts or weighted values and an array of bin edges describing the intervals used.
How do I choose the number of histogram bins?
Pass an integer for equal-width bins or an explicit edge array when domain boundaries matter; test the result against the data range.
What does density=True mean in NumPy histogram()?
It scales bin values so the integral across bin widths is approximately one; the values are not necessarily probabilities unless the bins have equal width.
How do I plot a NumPy histogram?
Use the returned edges with a plotting library or call its histogram helper, making sure the plotting convention matches whether counts or density is intended.
