
Quick answer: np.var computes the mean squared deviation from the mean. Interpretation depends on whether the data is the full population or a sample, the ddof denominator adjustment, the reduction axis, and whether NaN values are included or ignored.
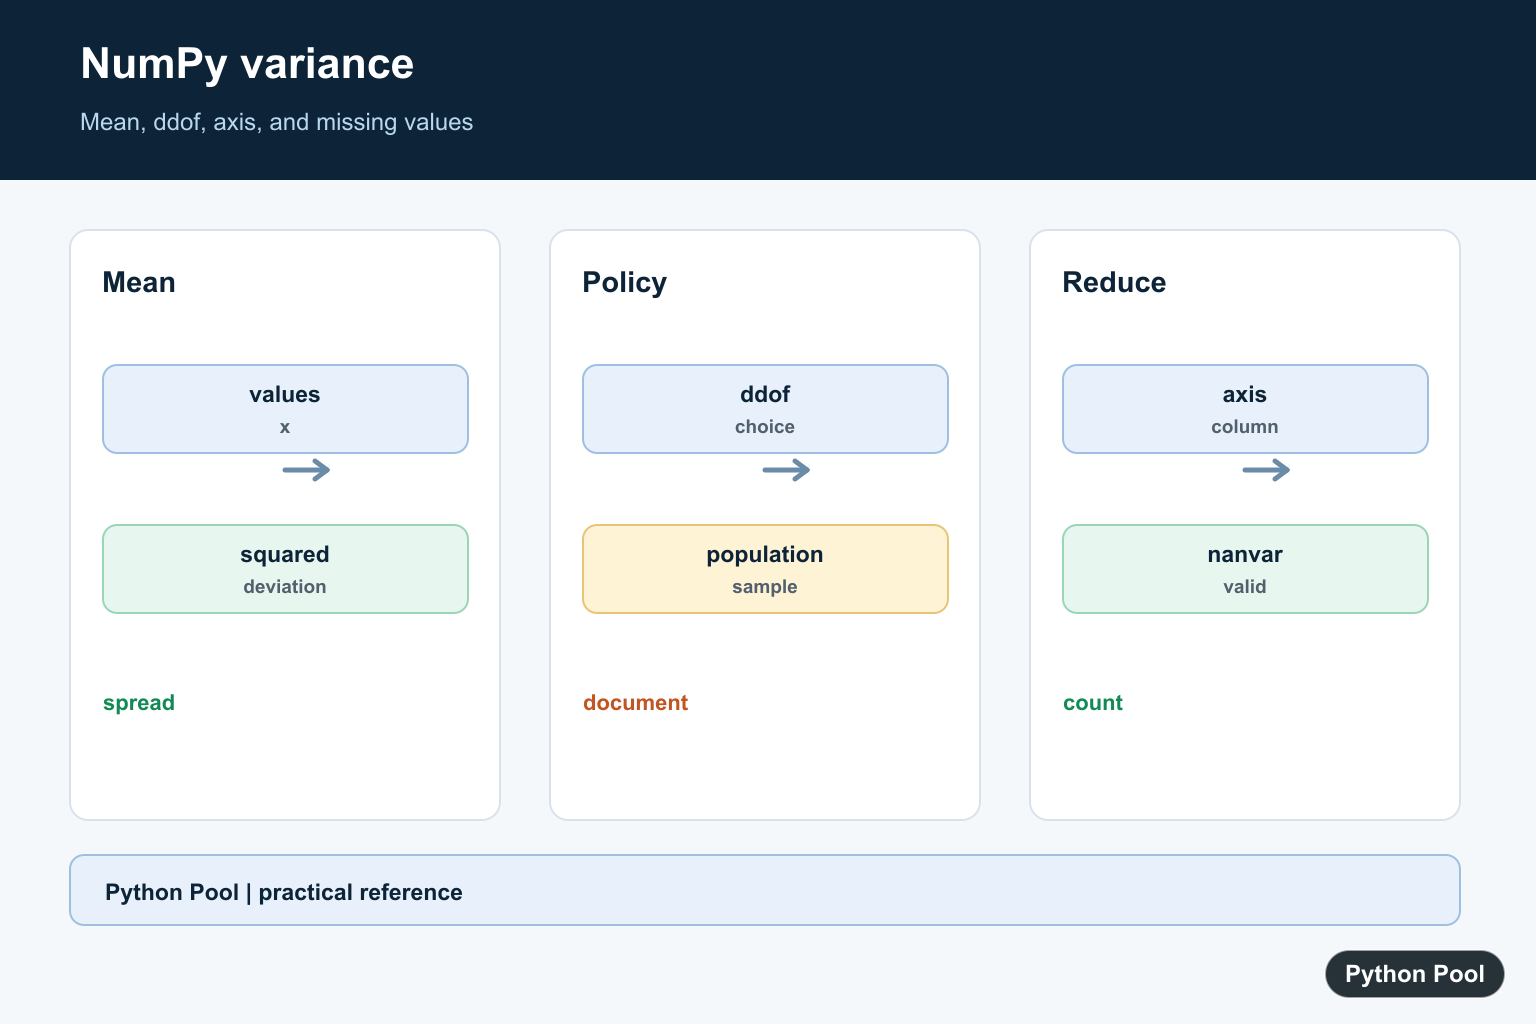
numpy.var() calculates variance, which measures average squared spread from the mean. Larger variance means values are more dispersed.
The official NumPy documentation covers numpy.var(), numpy.nanvar(), and numpy.std().
Variance is useful in statistics, quality checks, feature engineering, simulations, and model diagnostics. It is closely related to standard deviation: standard deviation is the square root of variance.
Because variance uses squared units, it is not always as intuitive as standard deviation. It is still useful for formulas and comparisons where squared spread is expected.
The main options are axis, ddof, dtype, and keepdims. These choices control how the summary is calculated and how the output is shaped.
Before using variance in a report, decide whether squared units will be clear to the audience. If the original data is measured in seconds, variance is measured in squared seconds, which is useful mathematically but harder to explain.
For that reason, variance often appears inside calculations, while standard deviation appears in explanatory summaries. Both come from the same spread idea.
Calculate A Basic Variance
Pass a one-dimensional array to np.var() to calculate one variance value.
import numpy as np

scores = np.array([10, 20, 30, 40])

result = np.var(scores)

print(result)
This returns the population variance for the scores.
Use this form when one spread summary is needed for a numeric array.
Variance is affected strongly by values far from the mean because differences are squared before they are averaged.
If two arrays have similar means but different variance values, the array with the higher variance is less consistent around its center.
Use ddof For Sample Variance
The ddof argument changes the divisor used in the calculation.
import numpy as np

scores = np.array([10, 20, 30, 40])

population = np.var(scores, ddof=0)
sample = np.var(scores, ddof=1)

print(population)
print(sample)
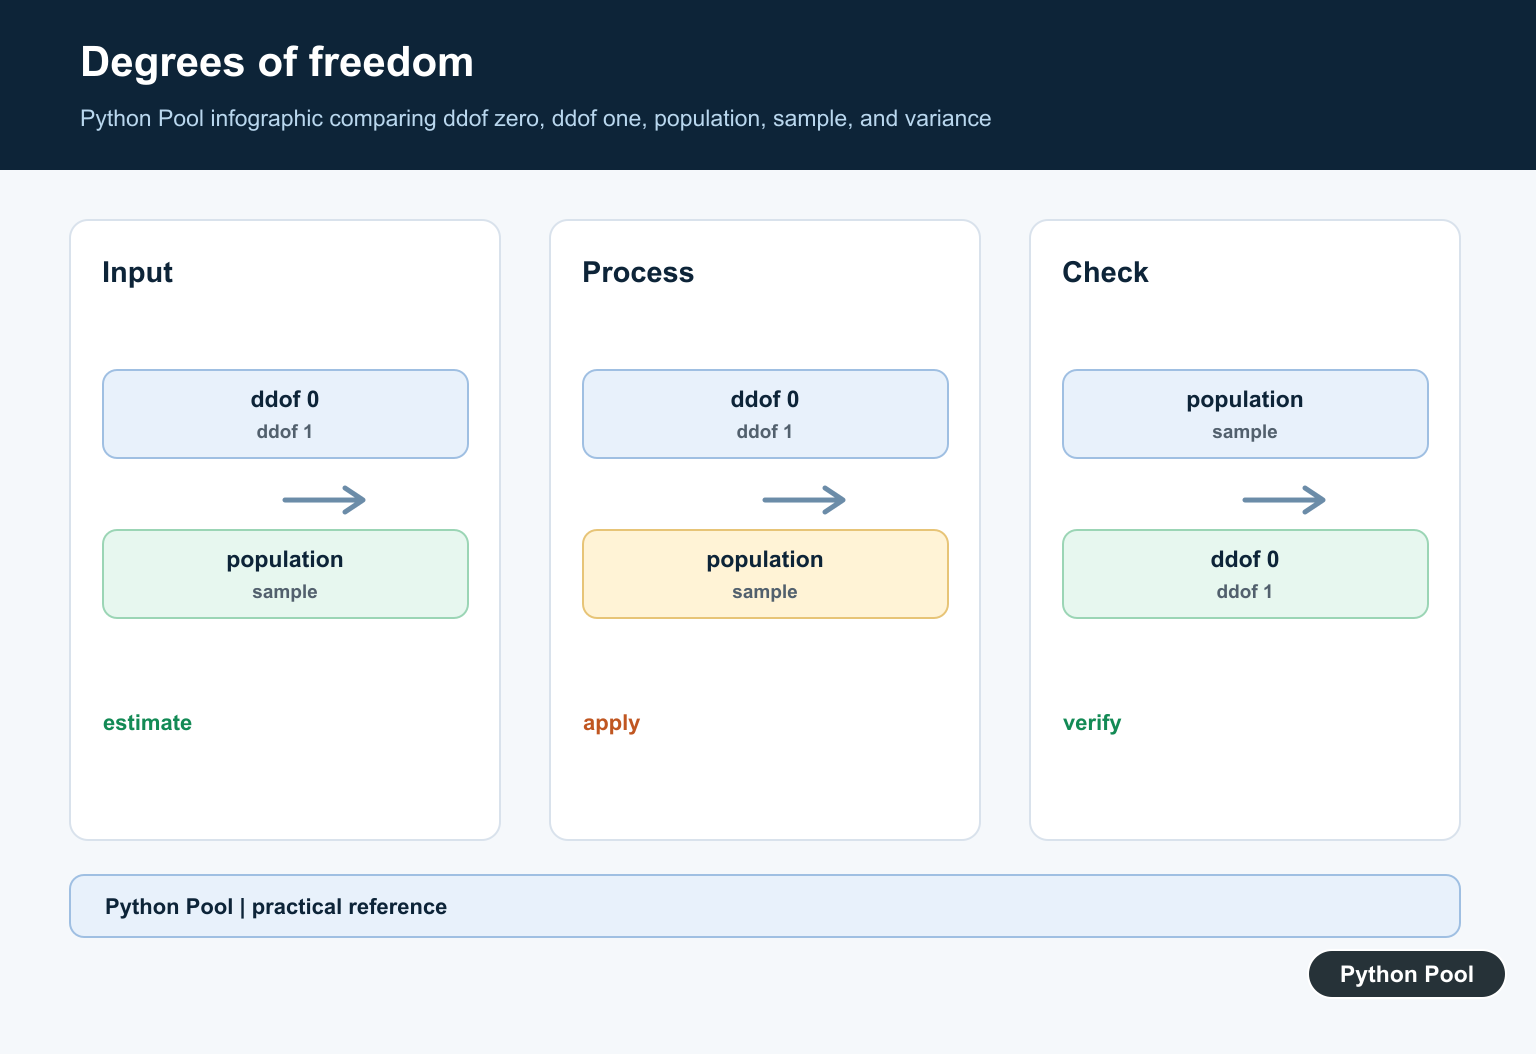
ddof=0 divides by N. ddof=1 divides by N - 1.
Use the setting required by your statistical process. Population and sample variance are both valid, but they are not interchangeable.
When matching a spreadsheet, textbook, or dashboard, confirm its degrees-of-freedom setting before comparing results.
This check prevents small differences from being misread as errors. Many tools use different defaults for sample and population statistics.
Variance Down Columns
Use axis=0 to calculate variance down each column.
import numpy as np

data = np.array([
    [10, 80],
    [20, 85],
    [30, 90],
])

result = np.var(data, axis=0)

print(result)
Each column receives its own variance value.
This is useful when columns represent separate measurements, features, or metrics.
Keep column summaries separate when columns use different units. A flattened variance across mixed units usually has no clear meaning.
Column variance is common when each column is a feature and you want to identify features with unusually high or low spread.
Variance Across Rows
Use axis=1 to calculate variance across each row.
import numpy as np

data = np.array([
    [10, 20, 30],
    [40, 50, 60],
])

result = np.var(data, axis=1)

print(result)
Each row receives its own variance value.
This is useful when each row is one record and columns hold repeated measurements for that record.
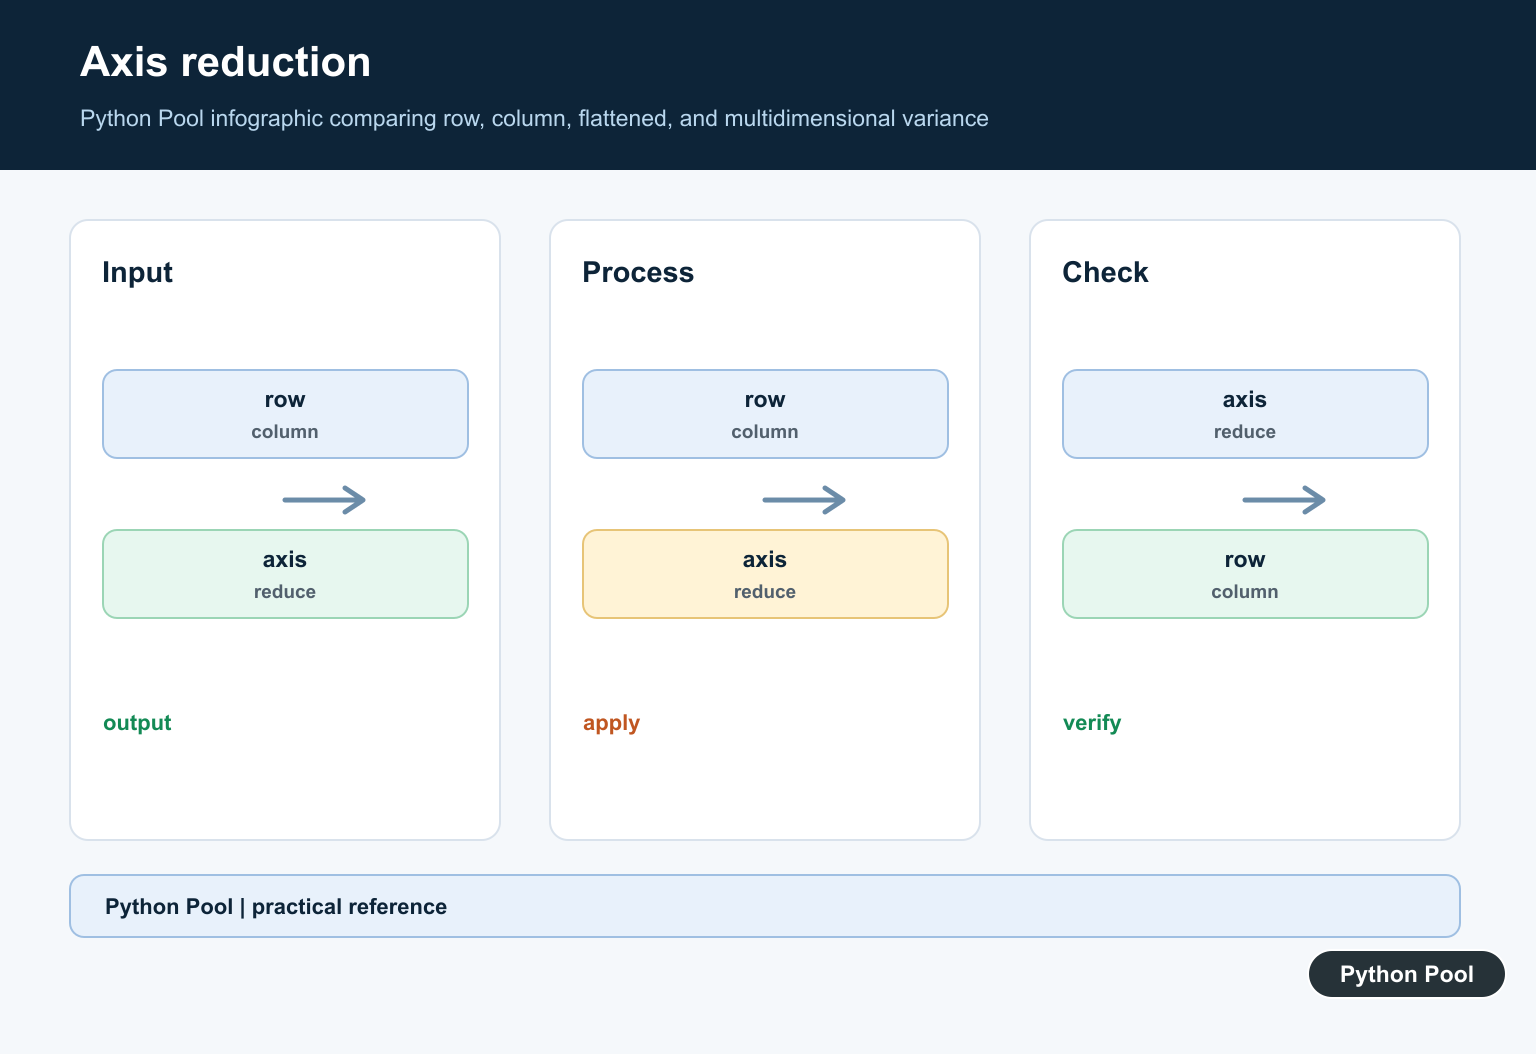
For arrays shaped like (rows, columns), axis=0 summarizes columns and axis=1 summarizes rows. Check this before publishing a table summary.
Row variance is useful when each row should be judged independently, such as repeated readings for one item or several scores for one record.
Set dtype And Keep Dimensions
Use dtype for a wider calculation type and keepdims=True when the reduced axis should remain in the result.
import numpy as np

data = np.array([
    [10, 20, 30],
    [40, 50, 60],
], dtype=np.int16)

result = np.var(data, axis=1, dtype=np.float64, keepdims=True)

print(result)
print(result.shape)
A wider dtype can help with precision for narrow integer inputs.
keepdims=True is useful when the result will be combined with the original array through broadcasting.
For simple printed output, the default reduced shape is often easier to read.
Ignore NaN Values
Use np.nanvar() when missing values are represented by nan and should be skipped.
import numpy as np

data = np.array([10, 20, np.nan, 40])

result = np.nanvar(data)

print(result)
This calculates variance from the non-NaN values.
Only skip missing values when that matches the data rule for the project. Sometimes missing values should be rejected or filled before statistics are calculated.
Document the missing-value rule so results can be reproduced.
If missing values represent failed measurements, skipping them may hide a data quality issue. In that case, validate first and calculate variance only after the data is clean.
Common variance Mistakes
The first common mistake is confusing variance and standard deviation. Variance is squared spread, while standard deviation returns to the original units.
The second mistake is forgetting the ddof setting. Population and sample variance produce different values.
The third mistake is omitting axis when row or column summaries are needed. Flattened, row-wise, and column-wise variance answer different questions.
In short, use np.var(data) for one variance value, set ddof to match the statistical rule, choose an axis for row or column summaries, and use np.nanvar() only when missing values should be ignored.
Calculate A Basic Variance
NumPy uses the population denominator by default. Keep the data type and units in mind because variance is expressed in squared units.
import numpy as np

values = np.array([2., 4., 6., 8.])
print(np.var(values))
Choose ddof Explicitly
For a sample estimate, ddof=1 uses one fewer degree of freedom. Neither choice is universally correct; match the estimator to the statistical question.
import numpy as np

values = np.array([2., 4., 6., 8.])
population = np.var(values, ddof=0)
sample = np.var(values, ddof=1)
print(population, sample)
Reduce Along An Axis
axis=0 reduces rows and returns a result for each column in a two-dimensional array, while axis=1 returns a result for each row. Confirm the shape before joining results to labels.
import numpy as np

values = np.array([[1., 2.], [3., 5.], [7., 11.]])
print(np.var(values, axis=0))
print(np.var(values, axis=1))
Handle NaN Values
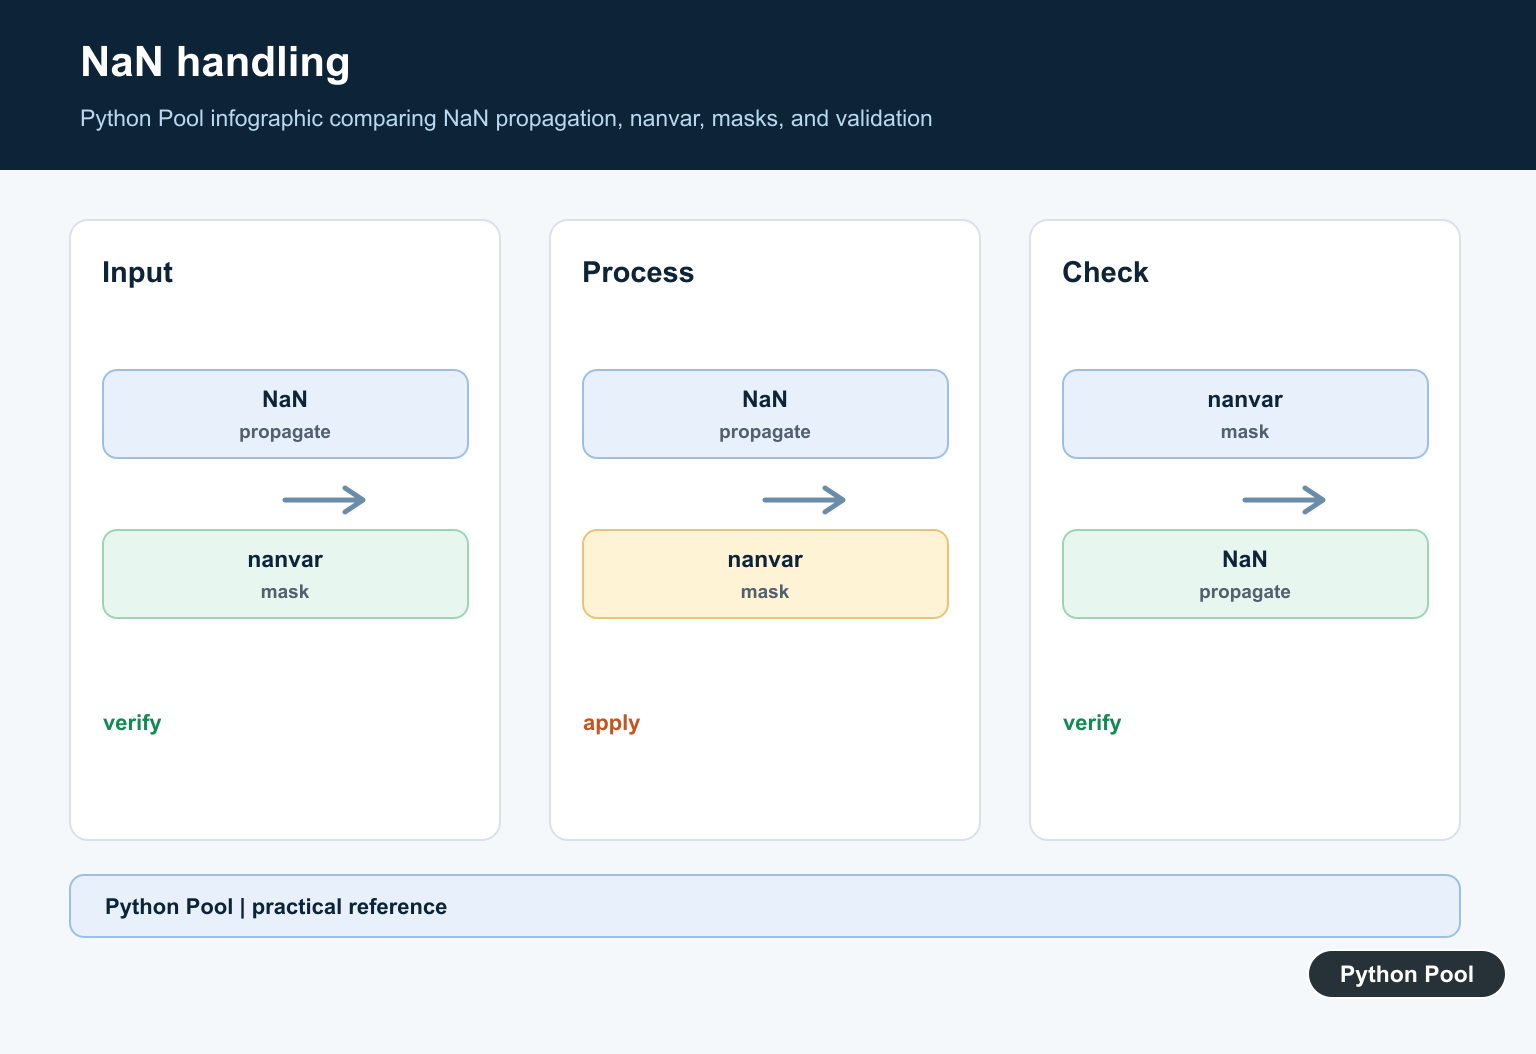
np.var propagates NaN by default. nanvar ignores NaN values, but a result based on too few observations may be misleading, so track valid counts as well.
import numpy as np

values = np.array([1., np.nan, 5.])
valid_count = np.count_nonzero(~np.isnan(values))
print(np.nanvar(values), valid_count)
NumPy’s var() and nanvar() references define axis, ddof, and missing-value behavior. Related references include numerical change, rolling averages, and array shifts.
For related numerical analysis, compare gradients, rolling averages, and axis reductions when interpreting spread.
Frequently Asked Questions
What does np.var calculate?
It calculates the average squared deviation from the mean along the chosen axis.
What does ddof mean in NumPy variance?
ddof subtracts from the number of observations used in the denominator, commonly separating population and sample estimates.
How do I calculate variance by column?
Pass axis=0 for column-wise reduction on a two-dimensional array, while axis=1 reduces across each row.
How do I ignore NaN values?
Use np.nanvar when ignoring NaN values is scientifically appropriate, and document how many valid observations remain.
