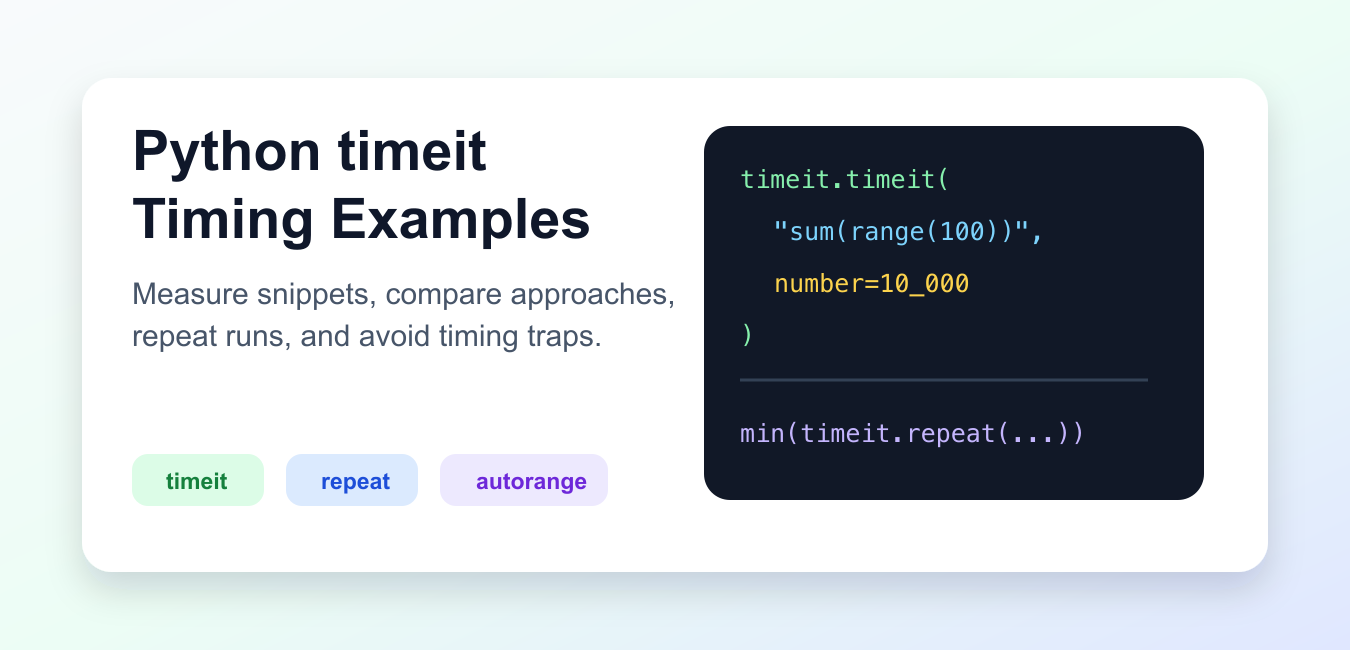
Quick answer: Use timeit for a focused microbenchmark: put setup outside the timed statement, run enough iterations, repeat the measurement, and inspect the result vector. timeit reduces common timing traps, but it does not explain an entire application’s call graph or replace production profiling.
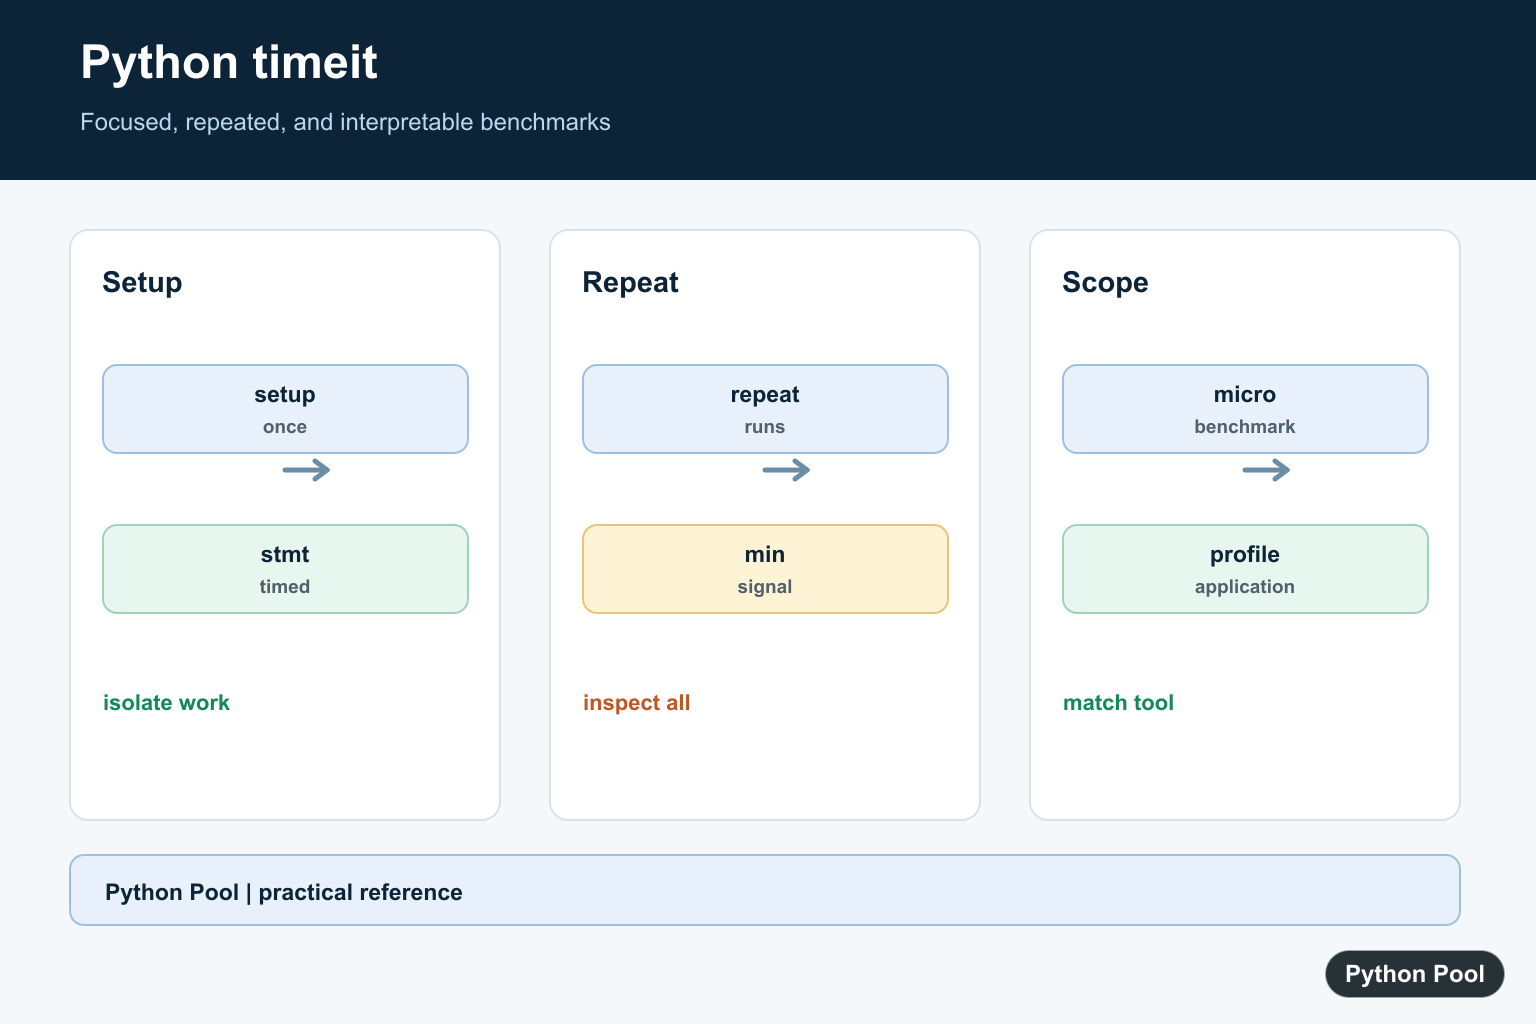
timeit is Python’s standard tool for measuring small code snippets. It runs the snippet many times, reduces setup noise, and reports elapsed time so you can compare approaches more fairly than with one manual timestamp.
Use it for focused microbenchmarks: a small expression, a function call, a parsing step, or a data-structure operation. It is not a full performance profiler for an entire application, but it is excellent for answering narrow questions.
The official Python timeit documentation explains timeit(), repeat(), Timer, setup code, and command-line usage. The official time module documentation covers clocks such as perf_counter().
Measure A Small Statement
The simplest form passes a statement string and the number of executions.
import timeit

elapsed = timeit.timeit("sum(range(100))", number=10_000)

print(elapsed)
print(elapsed / 10_000)
The first printed value is total elapsed seconds. Dividing by the loop count gives an average per execution, which is often easier to compare.
Use enough executions to make the result stable, but avoid numbers so large that each experiment becomes slow to run.
Provide Setup Code
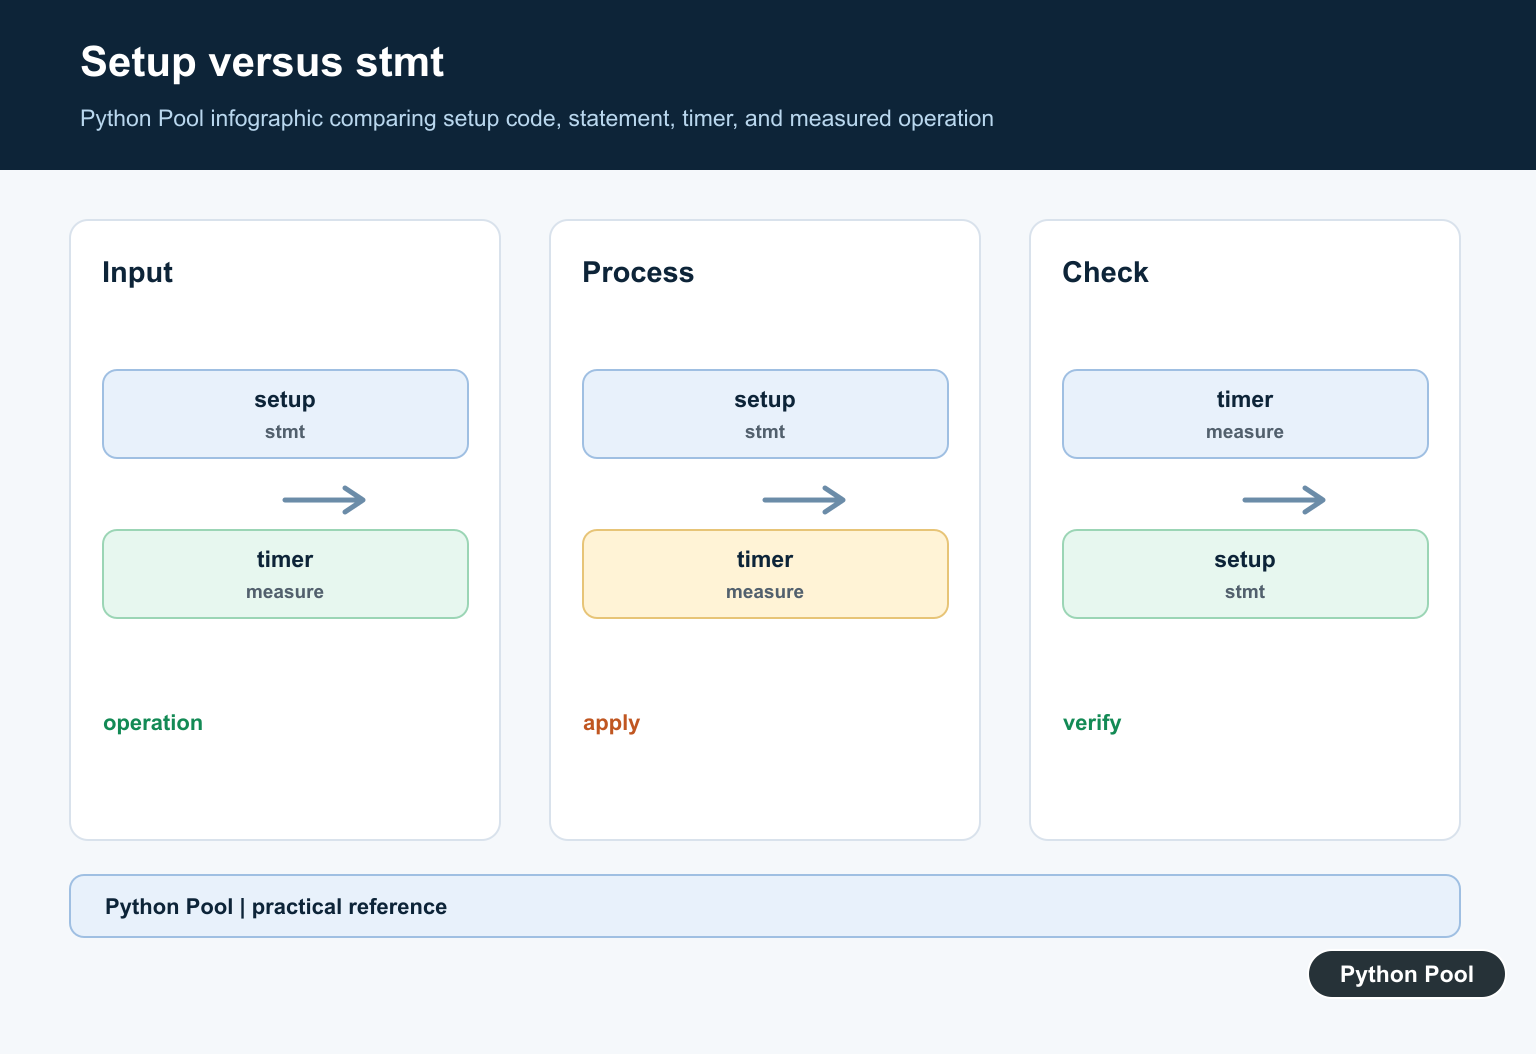
Use the setup argument when the timed statement needs imports or one-time preparation.
import timeit

elapsed = timeit.timeit(
    "math.sqrt(144)",
    setup="import math",
    number=100_000,
)

print(elapsed)
The setup code is not included in the measured loop. That keeps the result focused on the operation you are comparing.
Do not hide expensive work in setup if that work happens every time in the real program. The benchmark should match the real question you are asking.
Compare Two Functions
For functions already defined in your file, pass globals=globals() so timeit can find them.
import timeit

def use_join(parts):
    return "-".join(parts)

def use_loop(parts):
    text = ""
    for part in parts:
        text += part + "-"
    return text.rstrip("-")

parts = ["a", "b", "c", "d"]

join_time = timeit.timeit("use_join(parts)", globals=globals(), number=50_000)
loop_time = timeit.timeit("use_loop(parts)", globals=globals(), number=50_000)

print(join_time)
print(loop_time)
This pattern is clearer than placing long function definitions inside strings. It also lets editors and syntax checkers inspect the code normally.
Run both snippets with the same input and loop count. Otherwise, the comparison is not meaningful.
Repeat Runs And Choose The Best
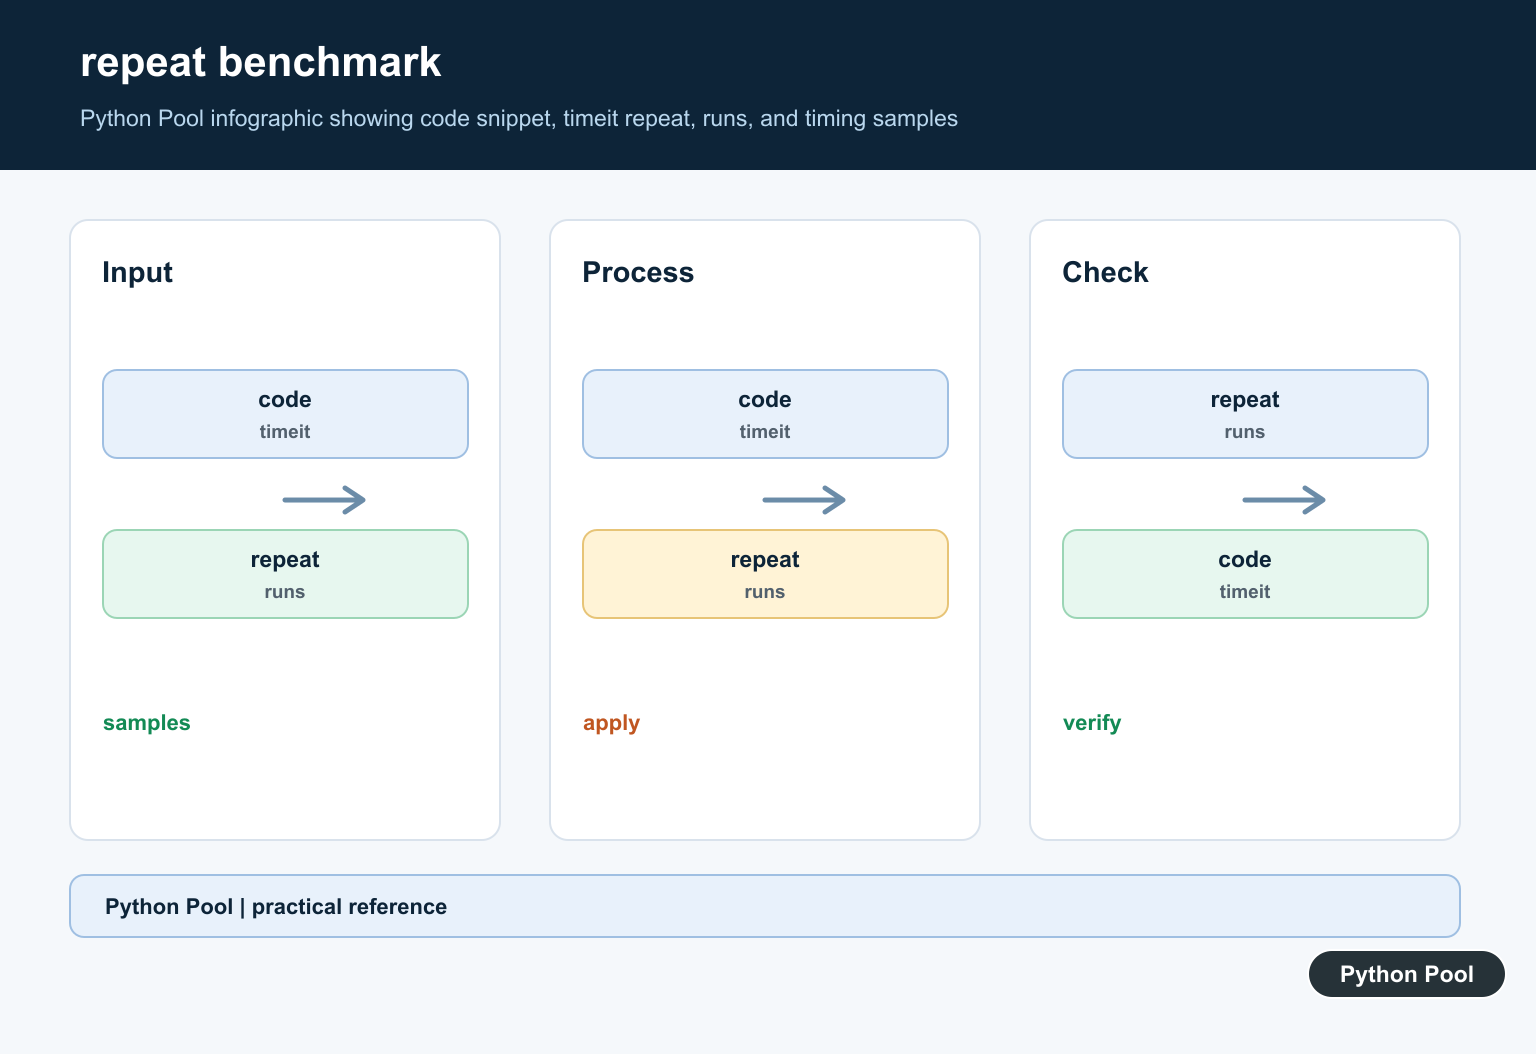
Timing results vary because of CPU scheduling, background tasks, caching, and other system activity. repeat() runs the benchmark several times.
import timeit

runs = timeit.repeat(
    "sorted([3, 1, 2, 5, 4])",
    repeat=5,
    number=20_000,
)

print(runs)
print(min(runs))
The documentation recommends looking at the minimum run for microbenchmarks because higher runs are often affected by outside interference.
Still, large spread between repeats is a warning sign. It may mean the benchmark is too small, the machine is busy, or the operation depends on external state.
Let Timer Pick A Loop Count
Timer.autorange() finds a loop count that gives a measurable runtime.
import timeit

timer = timeit.Timer("value * value", setup="value = 12")

loops, seconds = timer.autorange()

print(loops)
print(seconds)
print(seconds / loops)
This is useful when you do not know a good number value ahead of time. Fast operations need many loops, while slower operations need fewer.
After autorange gives a reasonable loop count, you can repeat the benchmark with that count to compare several approaches consistently.
Use perf_counter For Larger Blocks
For whole workflows, use time.perf_counter() around the code block. That measures elapsed wall-clock time without forcing the code into a small string.
from time import perf_counter

start = perf_counter()

total = sum(i * i for i in range(100_000))

elapsed = perf_counter() - start

print(total)
print(elapsed)
perf_counter() is better for coarse timing. timeit is better for small repeated snippets where setup, loop count, and repeat control matter.
Benchmark Carefully
Good timing tests start with a specific question. Instead of asking whether one program is faster than another, ask whether one small operation is faster for a representative input size. Narrow questions produce results you can act on.
Keep setup separate from the timed statement, but only when setup is not part of the real cost. For example, building a list once and sorting it many times may answer a different question than building and sorting the list every time.
Use realistic data sizes. Some approaches are faster for ten items and slower for a million items. If the real workload is large, test more than one size before choosing an implementation.
Run benchmarks on a quiet machine when possible. Browser tabs, indexing, virtual machines, and background sync tools can add noise. Repeating runs and checking the minimum helps, but it does not remove every source of interference.
Record the Python version, platform, input size, and code being measured when a timing result informs an engineering decision. Without that context, a number from timeit is hard to reproduce later.
Do not treat a microbenchmark as the final answer for application speed. Inputs, data size, memory behavior, and surrounding code can change the outcome. Use timeit to guide choices, then measure the real workload before making a broad performance claim.
Time A Callable With A Shared Namespace
Passing a callable is convenient for a small function. For string statements, pass globals=globals() or an explicit namespace so the timed code can access the objects it needs without repeating imports in every run.
import timeit


def build_values():
    return [str(number) for number in range(100)]

seconds = timeit.timeit(build_values, number=1000)
print(seconds)
Keep Setup Out Of The Measurement
Use setup for imports or data preparation that should happen once per timing run. If setup is included in the statement, the result answers a different question and may hide the operation you intended to compare.
import timeit

seconds = timeit.timeit(
    stmt="'-'.join(map(str, values))",
    setup="values = range(100)",
    number=1000,
)
print(seconds)
Repeat And Inspect The Results
repeat() returns several elapsed values. The minimum is often a useful lower-bound signal, but inspect all values because system scheduling and background work can affect slower repetitions.
import timeit

results = timeit.repeat("sum(range(100))", repeat=5, number=1000)
print(results)
print(min(results))
Use autorange For A Small Statement
autorange() increases the loop count until the timing run is long enough to be measurable. It is useful for tiny operations, but record the Python version, hardware, input shape, and benchmark code when comparing results across machines.
import timeit

timer = timeit.Timer("sum(range(100))")
number, elapsed = timer.autorange()
print(number, elapsed)
The official timeit documentation covers setup, repeat(), autorange(), callable statements, globals, and result interpretation. For larger blocks, compare the related Python timer guide and use a profiler when the question is broader than one operation.
For related performance measurement, compare the Python timer tools, trace module, and threading vs multiprocessing when deciding whether a microbenchmark or broader diagnostic is needed.
Frequently Asked Questions
What is Python timeit used for?
timeit measures small code snippets repeatedly so you can compare focused operations with less timing noise than one manual timestamp.
What is the difference between timeit() and repeat()?
timeit() runs a statement a specified number of times, while repeat() runs that timing several times and returns a list of elapsed results.
Why is the minimum time often reported?
The fastest repetition is a useful lower-bound signal because slower runs often include interference from other processes, but the full result vector still needs context.
Is timeit a replacement for a profiler?
No. Use timeit for narrow microbenchmarks and a profiler or production measurement for understanding an entire application’s call graph and workload.
