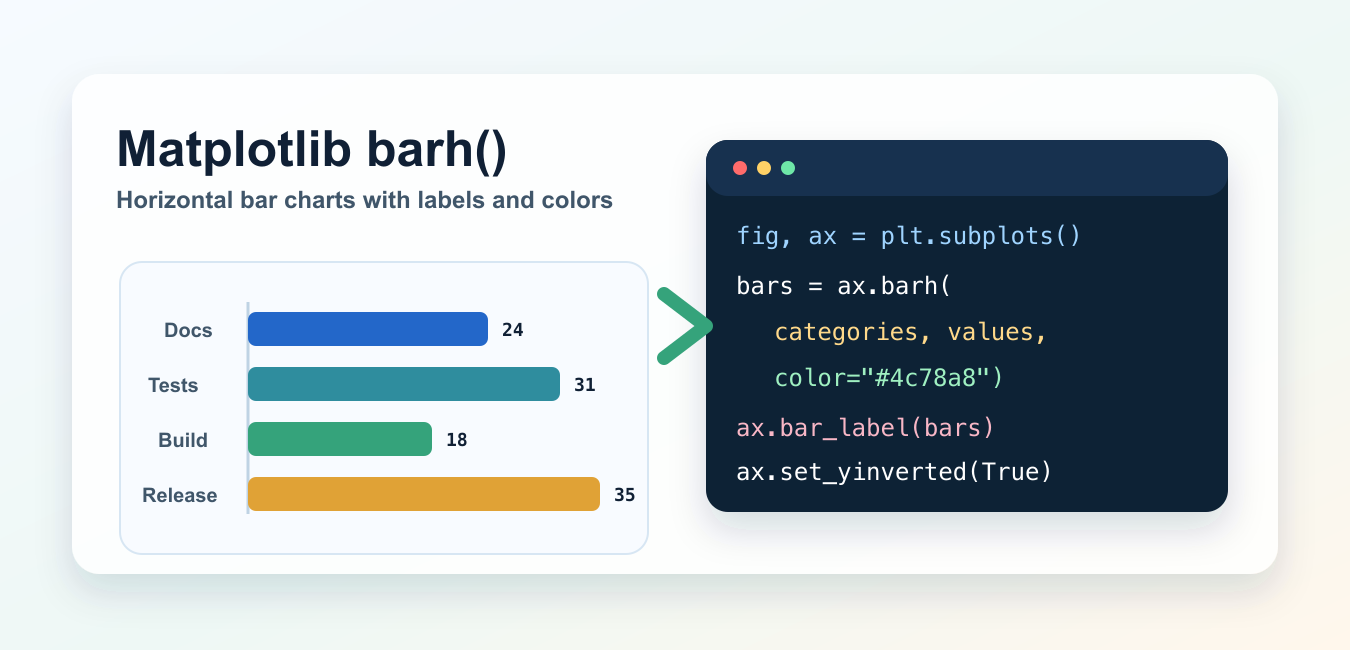
matplotlib.pyplot.barh() creates horizontal bar charts in Python. It is a strong choice when category names are long, when a ranking should read from top to bottom, or when a vertical chart would force labels to rotate.
Quick Answer
Use fig, ax = plt.subplots(), call ax.barh(categories, values), label the x-axis, and call ax.invert_yaxis() when the first category should appear at the top. Use bar_label() for values, left for stacks, and xerr for horizontal error bars.
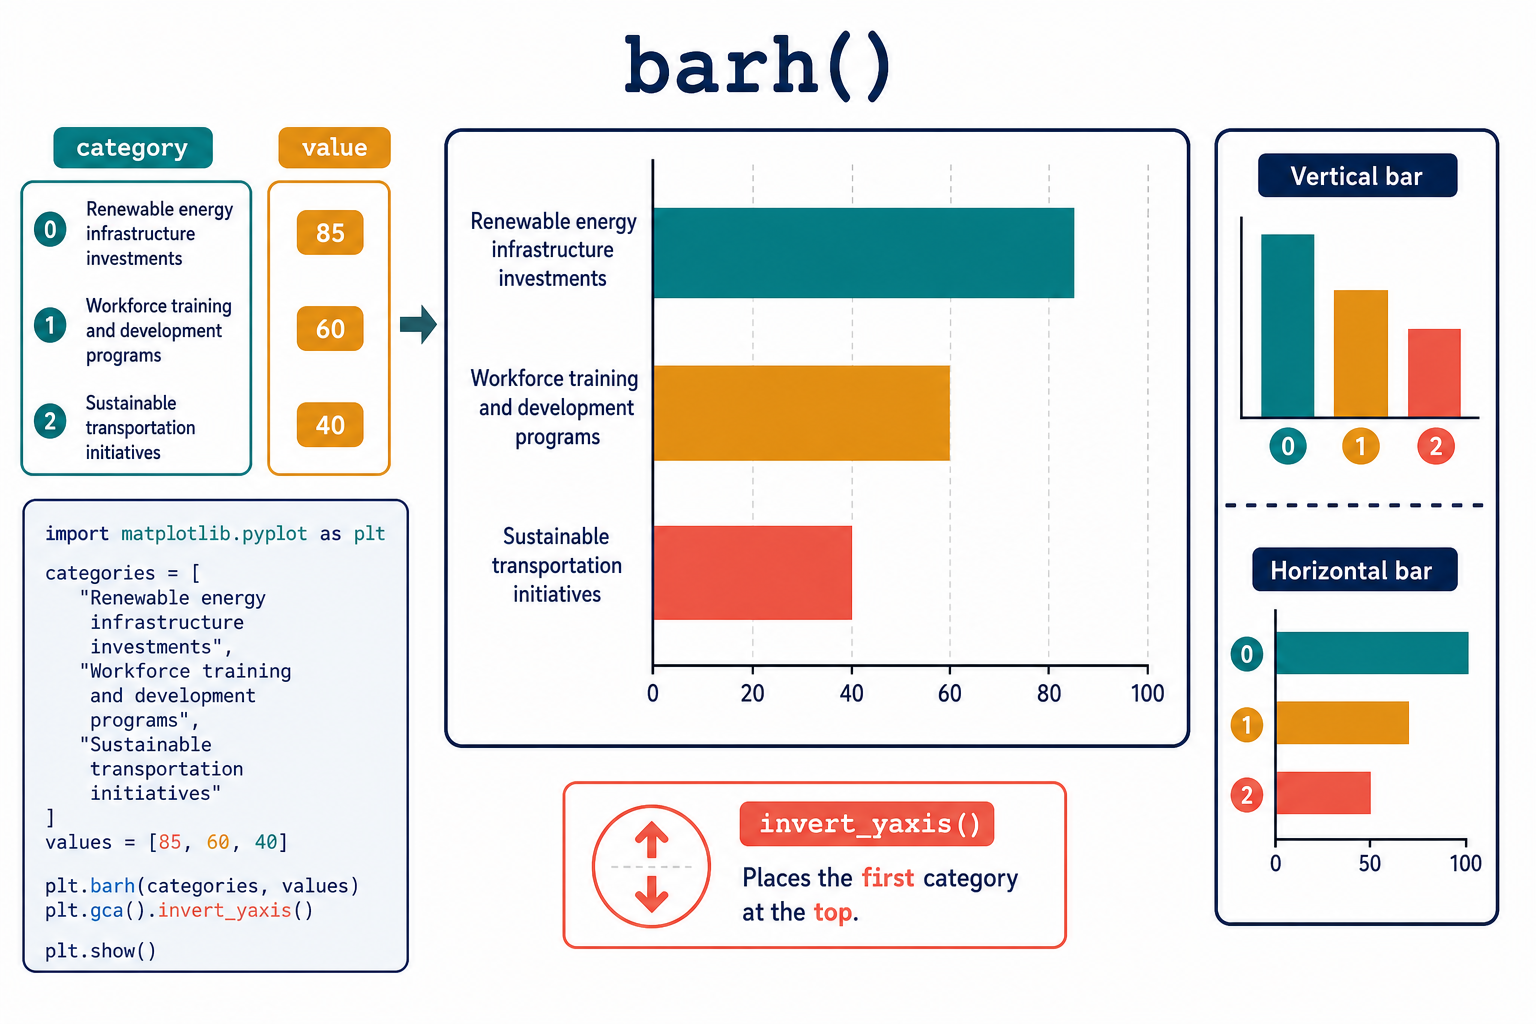
The official barh() API reference documents the y positions, widths, heights, and left baseline. The horizontal bar chart example shows the common top-to-bottom ordering pattern.
Basic barh() Example
The object-oriented API keeps the axes handle available for labels, limits, and annotations.
import matplotlib.pyplot as plt

categories = ['API', 'CLI', 'Notebook']
values = [72, 48, 61]

fig, ax = plt.subplots()
bars = ax.barh(categories, values)
ax.set_xlabel('Requests')
ax.bar_label(bars, padding=4)
plt.tight_layout()
plt.show()
barh() accepts a scalar or a sequence for each of the category positions, widths, heights, and left offsets. The sequences must line up: one value should correspond to each category.
Order Categories From Top To Bottom
Matplotlib’s default y-axis direction can make the first category appear at the bottom. Sorting the data and inverting the y-axis gives a readable ranking.
import matplotlib.pyplot as plt

categories = ['API', 'CLI', 'Notebook']
values = [72, 48, 61]

fig, ax = plt.subplots()
bars = ax.barh(categories, values, height=0.55,
               color=['#0f766e', '#f59e0b', '#ef4444'])
ax.bar_label(bars, fmt='%.0f')
ax.invert_yaxis()
plt.show()
Use ax.invert_yaxis(), not a made-up setter such as set_yinverted(). If the order carries meaning, sort the source data before plotting so the chart remains reproducible.
Sort Data Before Plotting
Keep labels and values together while sorting. Sorting one list without the other is a common cause of misleading charts.
import matplotlib.pyplot as plt

items = [('Notebook', 61), ('API', 72), ('CLI', 48)]
items = sorted(items, key=lambda item: item[1])
labels = [item[0] for item in items]
values = [item[1] for item in items]

fig, ax = plt.subplots()
ax.barh(labels, values)
ax.invert_yaxis()
plt.show()
For descending charts, reverse the sorted sequence or invert the axis according to the visual order you want. Write that decision in code so a later data refresh does not silently change the story.
Add Value Labels And Styling
The returned BarContainer can be passed to ax.bar_label(). Use a small, consistent color set and leave enough space for text.
For long labels, increase the figure width, use a smaller but readable font, or wrap labels before plotting. Do not hide labels by shrinking the whole figure until the text becomes inaccessible on a phone.
Build Stacked Horizontal Bars
Pass the width of the earlier segment through left to start the next segment at the correct x position.
import matplotlib.pyplot as plt

categories = ['API', 'CLI', 'Notebook']
first = [50, 30, 45]
second = [22, 18, 16]

fig, ax = plt.subplots()
ax.barh(categories, first, label='completed')
ax.barh(categories, second, left=first, label='pending')
ax.legend()
plt.show()
Every left value must represent the cumulative width for that category. A single scalar is fine for one common baseline; a sequence is needed when each category has a different previous segment.
Show Error Bars With xerr
Because the numeric axis is horizontal, uncertainty in the bar width is represented with xerr. The error sequence should align with the values.
import matplotlib.pyplot as plt

categories = ['API', 'CLI', 'Notebook']
values = [72, 48, 61]
errors = [4, 3, 5]

fig, ax = plt.subplots()
ax.barh(categories, values, xerr=errors, capsize=4)
ax.set_xlabel('Requests plus or minus error')
plt.show()
Error bars communicate measurement uncertainty or variation; they should not be used as decorative whiskers. Add a note or legend when readers need to know what the error value represents.
Layout And Readability
Use figsize, ax.set_xlim(), and plt.tight_layout() or fig.tight_layout() to keep labels inside the figure. With very long category names, constrained_layout=True can also help.
For many categories, reduce clutter by selecting the relevant subset, grouping low-volume categories, or using a scrollable interactive view. A chart with every available category is not automatically more informative.
barh() Compared With bar()
bar() is vertical and maps categories to x positions; barh() is horizontal and maps categories to y positions. Choose the orientation that makes the labels and comparison easiest to scan. Both functions return a BarContainer that can be labeled with bar_label().
For complex figures, keep explicit ax variables and avoid relying on the global pyplot state. The related Matplotlib gca() guide explains why explicit axes are often easier to maintain.
Common barh() Problems
- Categories and values have different lengths.
- The first category appears at the bottom because the y-axis was not inverted.
- Long labels are clipped because the figure is too narrow.
- Stacked segments overlap because
leftis not cumulative. - Value labels are clipped because the x-axis has no extra margin.
Start with a small, known dataset, verify the order and units, then add styling. This makes a horizontal chart easier to test and less likely to communicate a false comparison.
Important barh() Arguments
The y argument supplies category positions or labels, and width supplies the numeric extent of each bar. height controls bar thickness, left shifts the baseline, and align controls how a bar is positioned around its y coordinate. Most visual properties, such as alpha, edge color, and hatch, are forwarded to the underlying Rectangle artists.
Use a sequence when each category needs a different height or baseline. A scalar is broadcast to every bar. If a sequence has the wrong length, the resulting error is usually a data-shape problem rather than a Matplotlib styling problem.
Negative Values And Zero
Horizontal bars can extend left when a width is negative. This is useful for diverging comparisons, but label placement and x-axis limits need more care. Include a visible zero line when readers need to distinguish positive and negative values.
Zero-width bars may be invisible even though their category labels are present. Add a value label or a small minimum display width only when that choice is explained, because visual exaggeration can distort a comparison.
Ticks, Units, And Accessible Labels
Always label the numeric axis with its unit, such as milliseconds, requests, dollars, or percent. A chart title alone rarely tells a reader whether a value is a count, rate, or measurement.
Use color as a secondary cue rather than the only way to distinguish categories. Bar labels, hatching, direct annotations, and a legend help readers with color-vision differences and also improve scanning on small screens.
Dates And Categorical Data
For dates or times, decide whether the categories are labels or actual numeric date coordinates. If the y positions represent dates, use the matching Matplotlib units and format the axis deliberately. For ordinary named categories, a list of strings is simpler and keeps the intent obvious.
Do not mix a category list from one data frame with values from a differently sorted frame. Build one sorted table or list of records, then derive both labels and widths from that same sequence.
Choose A Figure Size For The Labels
Long category names need horizontal space on the left, while value labels need space on the right. Increase the figure width before reducing the font. When exporting, test the saved image at its actual display size and check that the first and last labels are not clipped.
For a responsive article, prefer an image with readable labels and include the underlying data or code in the page as text. The image should support the explanation, not be the only place where the values are available.
Frequently Asked Questions
What does Matplotlib barh() do?
barh() creates a horizontal bar plot. The category positions are placed on the y-axis and the bar widths represent values along the x-axis.
How do I put the largest bar at the top?
Sort the categories and values in the order you want, then call ax.invert_yaxis() so the first category is displayed at the top of the chart.
How do I add numbers to horizontal bars?
Keep the BarContainer returned by ax.barh() and pass it to ax.bar_label(). Adjust padding or the x-axis limit when labels need extra room.
How do I make a stacked horizontal bar chart?
Call barh() more than once with the same categories and pass the cumulative previous widths through the left argument.
