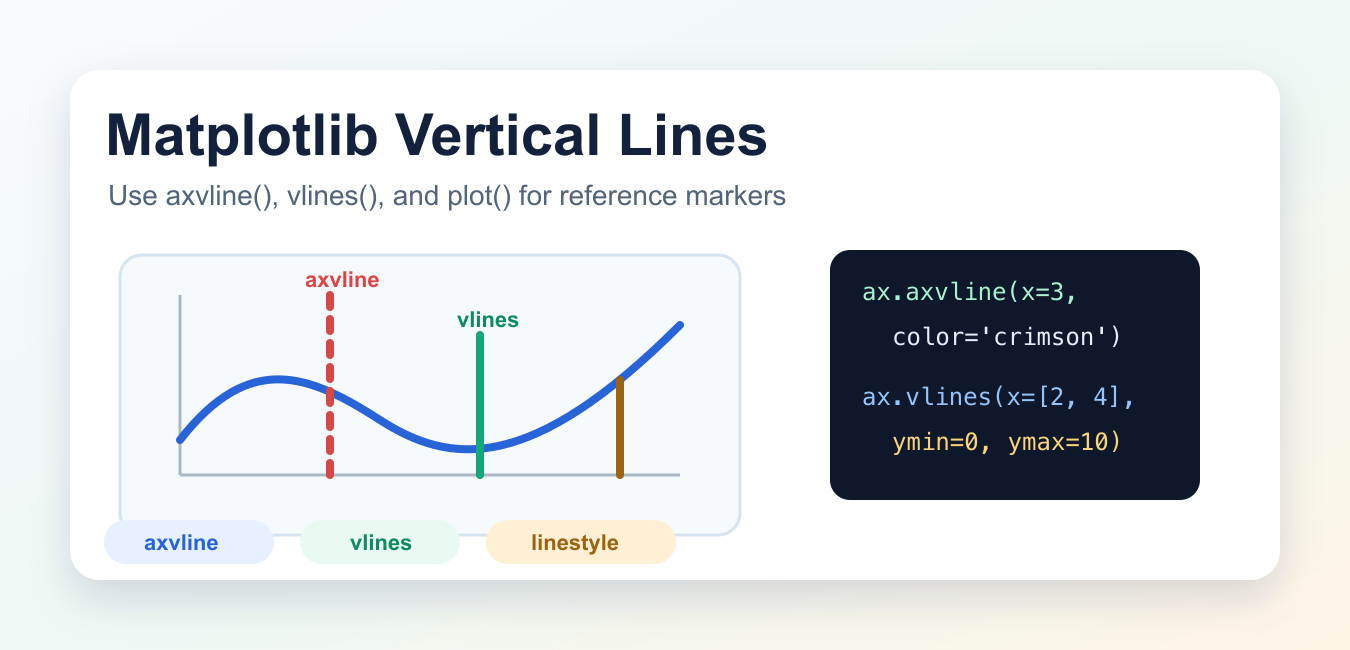
Quick answer: Use axvline() for a vertical marker that spans the axes, vlines() for vertical segments defined in data coordinates, and plot() when a line should behave like ordinary x-y data. Choose the function from the coordinate system you need.
Vertical lines are useful reference markers in Matplotlib charts. You can mark a threshold, event time, cutoff, peak location, or comparison point without changing the plotted data.
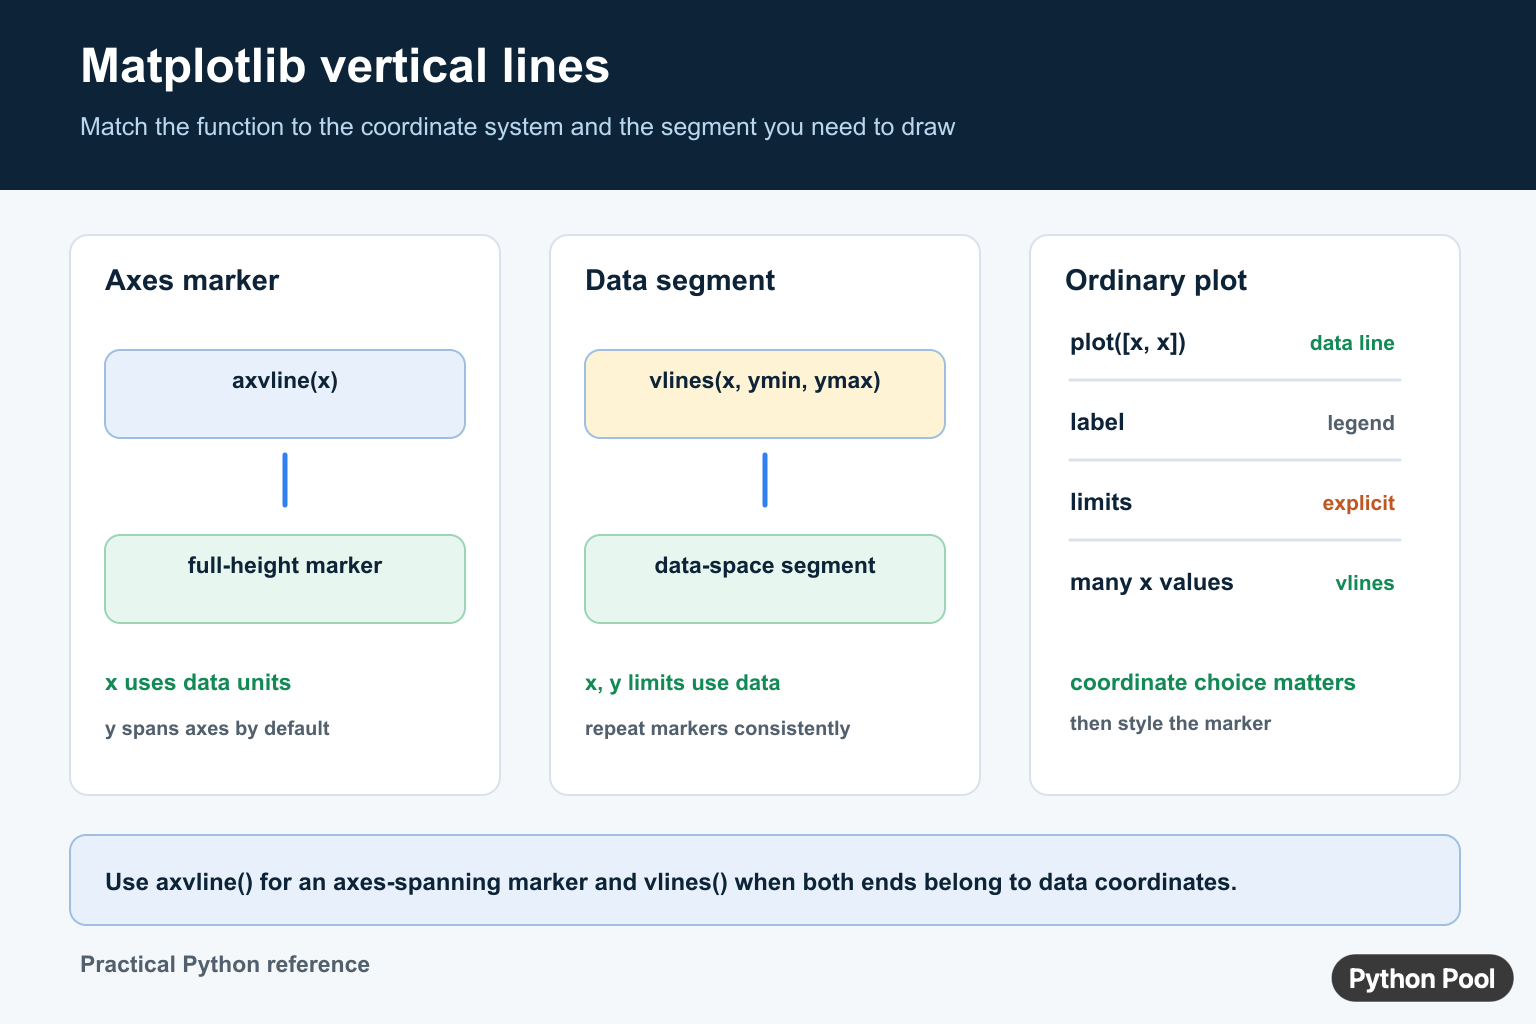
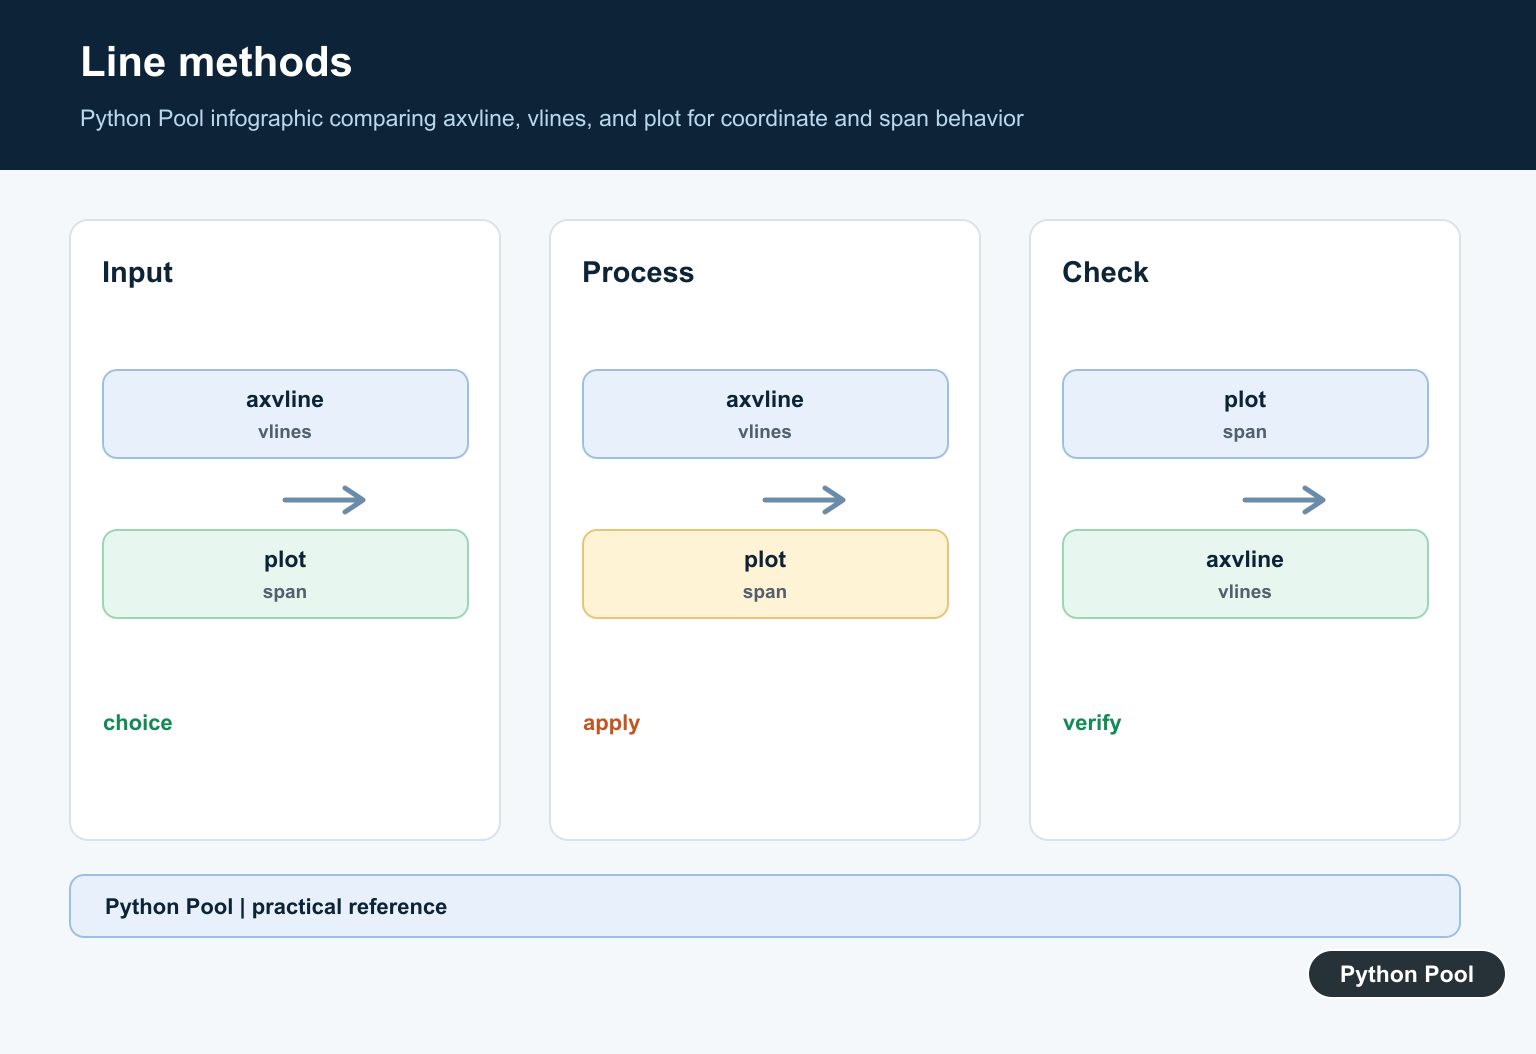
The three common ways to draw vertical lines are ax.axvline(), ax.vlines(), and ax.plot(). The best choice depends on whether the line should span the whole Axes, use exact y-data limits, or behave like a regular plotted line.
Quick Choice: axvline vs vlines vs plot
| Method | Best use |
|---|---|
ax.axvline() |
One vertical reference line that spans all or part of the Axes height. |
ax.vlines() |
One or many vertical lines with y start and y end in data coordinates. |
ax.plot([x, x], [y1, y2]) |
A vertical line that should behave like any other plotted line. |
Draw One Vertical Line With axvline()
axvline() is the simplest option for a full-height reference line. The x value is in data coordinates, while ymin and ymax are in axes-fraction coordinates from 0 to 1.
import numpy as np
import matplotlib.pyplot as plt

x = np.linspace(0, 10, 100)
y = np.sin(x)

fig, ax = plt.subplots()
ax.plot(x, y)

ax.axvline(x=3, color="crimson", linestyle="--", linewidth=2)

plt.show()
Because ymin=0 and ymax=1 by default, the line runs from the bottom to the top of the Axes.
Draw a Partial-Height axvline()
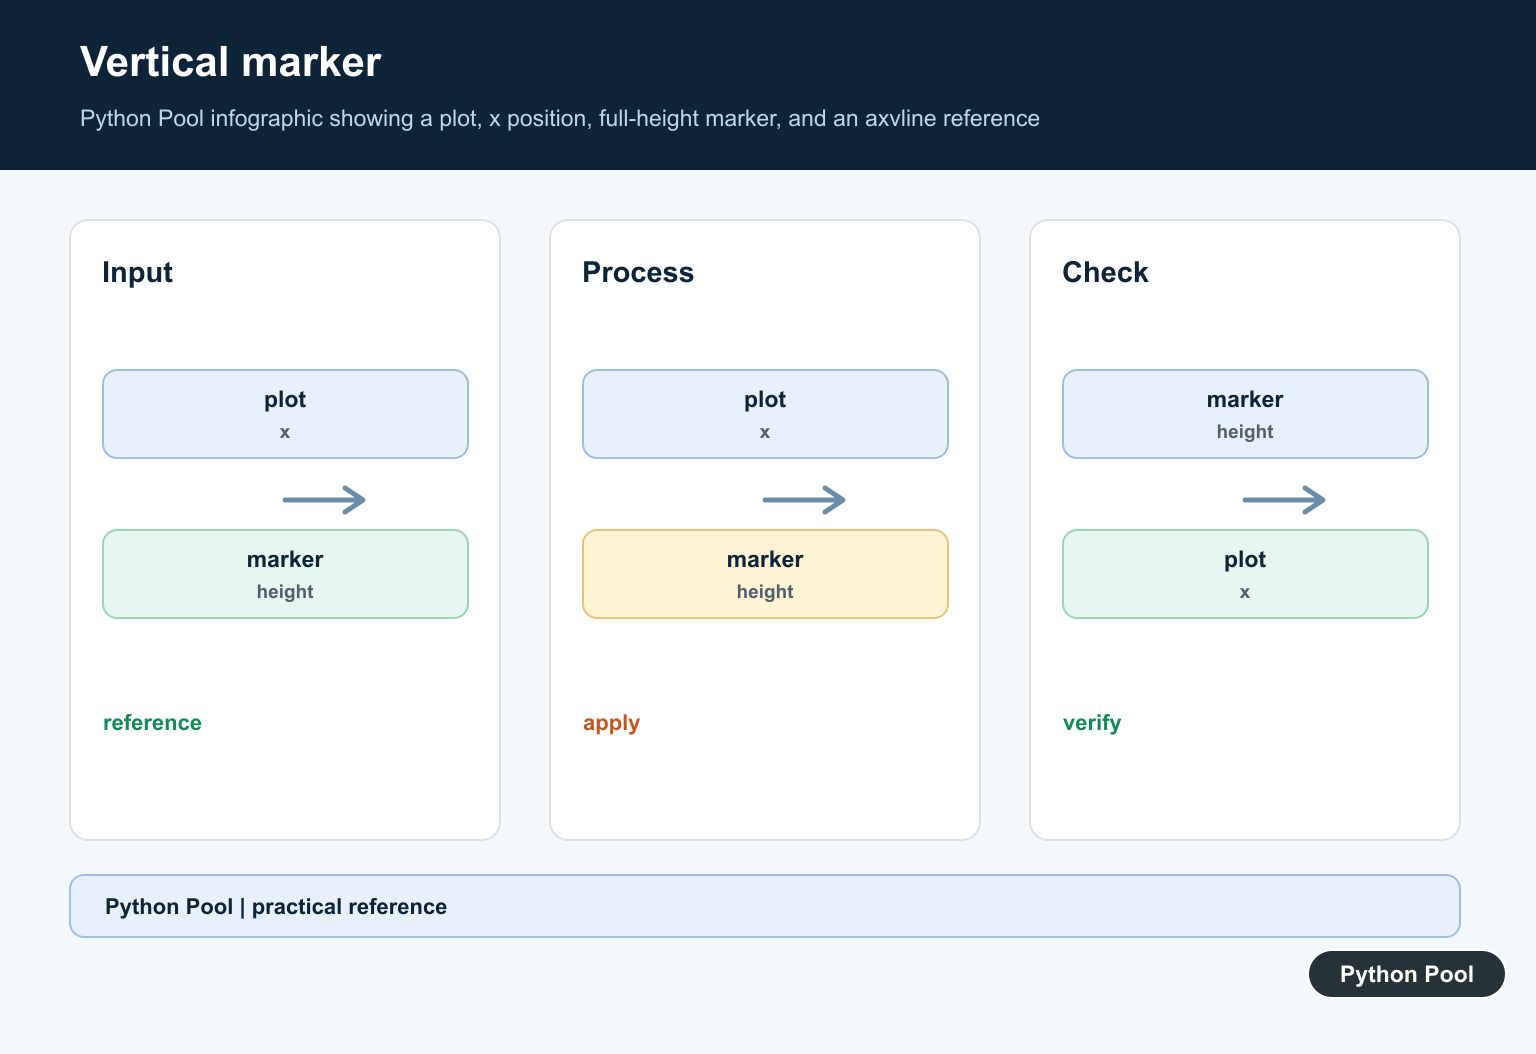
Use ymin and ymax when the line should cover only part of the plot height. Remember that these values are not y-data values.
ax.axvline(
    x=5,
    ymin=0.2,
    ymax=0.8,
    color="black",
    linestyle=":",
    linewidth=2,
)
This draws a vertical line at x=5 from 20% to 80% of the Axes height. If you need y positions such as ymin=-0.5 and ymax=0.5 in data units, use vlines() instead.
Use vlines() for Data-Coordinate y Limits
vlines() accepts one x value or many x values. Its ymin and ymax values are data coordinates, which makes it better for vertical intervals.
fig, ax = plt.subplots()
ax.plot(x, y)

ax.vlines(
    x=[2, 4, 6],
    ymin=-0.5,
    ymax=0.5,
    colors="seagreen",
    linestyles="solid",
    linewidth=2,
)

plt.show()
This draws three vertical line segments. Each segment starts at y=-0.5 and ends at y=0.5.
Draw a Vertical Line With plot()
You can also draw a vertical line by plotting two points with the same x value.
ax.plot([7, 7], [-1, 1], color="orange", linewidth=3)This is useful when you want the line to be part of a normal line plot workflow. For most reference markers, axvline() or vlines() communicates the intent more clearly.
Add Labels to Vertical Lines
A vertical line is often more useful with a label. Use annotate() when the label should point to the marker.
ax.axvline(x=3, color="crimson", linestyle="--")

ax.annotate(
    "cutoff",
    xy=(3, 0.8),
    xycoords=("data", "axes fraction"),
    xytext=(8, 0),
    textcoords="offset points",
    color="crimson",
)
For more callout patterns, see the Matplotlib annotate guide.
Common Styling Options
Vertical-line methods accept regular Matplotlib line styling options such as color, linestyle, linewidth, alpha, and label.
ax.axvline(
    x=3,
    color="crimson",
    linestyle="--",
    linewidth=2,
    alpha=0.8,
    label="event",
)
ax.legend()
If the vertical line makes the chart look too busy, reduce alpha, use a dashed line, or choose a muted color.
Common Mistakes
- Using
axvline()with y-data limits. Itsyminandymaxare axes-fraction values, not y-axis values. - Forgetting axis limits. If the marker is outside the x-axis range, it will not be visible. Check current limits with Matplotlib ylim and matching x-axis methods.
- Adding too many reference lines. Use
vlines()for repeated markers and choose light styling. - Calling pyplot functions in multi-axes figures. Prefer
ax.axvline()andax.vlines()on the intended Axes. The Matplotlib gca guide explains current Axes behavior.
Related Matplotlib Guides
For more plot styling, read how to change Matplotlib background color, how to clear a Matplotlib plot, and Matplotlib pcolormesh.
Official References
- Matplotlib Axes.axvline documentation
- Matplotlib Axes.vlines documentation
- Matplotlib pyplot.axvline documentation
Conclusion
Use ax.axvline() for simple full-height reference markers, ax.vlines() for one or many vertical segments with y-data limits, and ax.plot() when the marker should act like a regular line. The main thing to remember is the coordinate difference between axvline() and vlines().
Understand The Coordinate Systems
axvline(x) takes x in data coordinates, while its default y extent uses axes coordinates from bottom to top. That makes it useful for a reference marker that should span the plot even when the y limits change.
import matplotlib.pyplot as plt

fig, ax = plt.subplots()
ax.plot([0, 1, 2], [2, 1, 3])
ax.axvline(1, color="crimson", linestyle="--", label="threshold")
ax.legend()
plt.show()
Use vlines For Data Segments
Use ax.vlines() when each vertical line has data-coordinate starts and ends. This is a better fit for intervals, error bars, or many segments with different heights.
ax.vlines([0.5, 1.5], ymin=[0, 1], ymax=[2, 3], color="black")
Labels, legends, clipping, z-order, and line styles are separate presentation decisions. Give a marker a useful label only when the legend helps explain the plot, and choose a color that remains readable when the figure is printed or viewed without color.
Choose Limits And Labels
Use ax.set_xlim() when a marker should be visible inside a known range, and use a concise label when the line represents a threshold or event. A vertical line should support the data story rather than obscure a dense series.
For repeated markers, keep the positions in a list and use one call to vlines() where possible. This keeps styling consistent and makes later changes to the marker set easier to review.
That approach also makes it easier to test the marker positions separately from the plot styling. Keep the data-coordinate limits explicit when the segments must align with other plotted measurements.
Frequently Asked Questions
How do I draw a vertical line in Matplotlib?
Call axvline(x=value) to draw a vertical marker at a data-coordinate x position across the axes by default.
What is the difference between axvline() and vlines()?
axvline() combines a data-coordinate x value with an axes-spanning y extent, while vlines() uses data coordinates for x, ymin, and ymax.
How do I draw multiple vertical lines?
Store the marker positions in a sequence and use repeated axvline() calls or one vlines() call when the data-space segments share styling.
How do I label a vertical line?
Pass a label to the line artist and call ax.legend(), or annotate the marker directly when the label needs a specific position.
