
Quick answer: Matplotlib has separate surfaces for the Axes plot area and the Figure around it. Use ax.set_facecolor() for the inner plotting region, fig.patch.set_facecolor() for the outer canvas, and savefig(facecolor=…) when the file’s background must match the displayed figure.
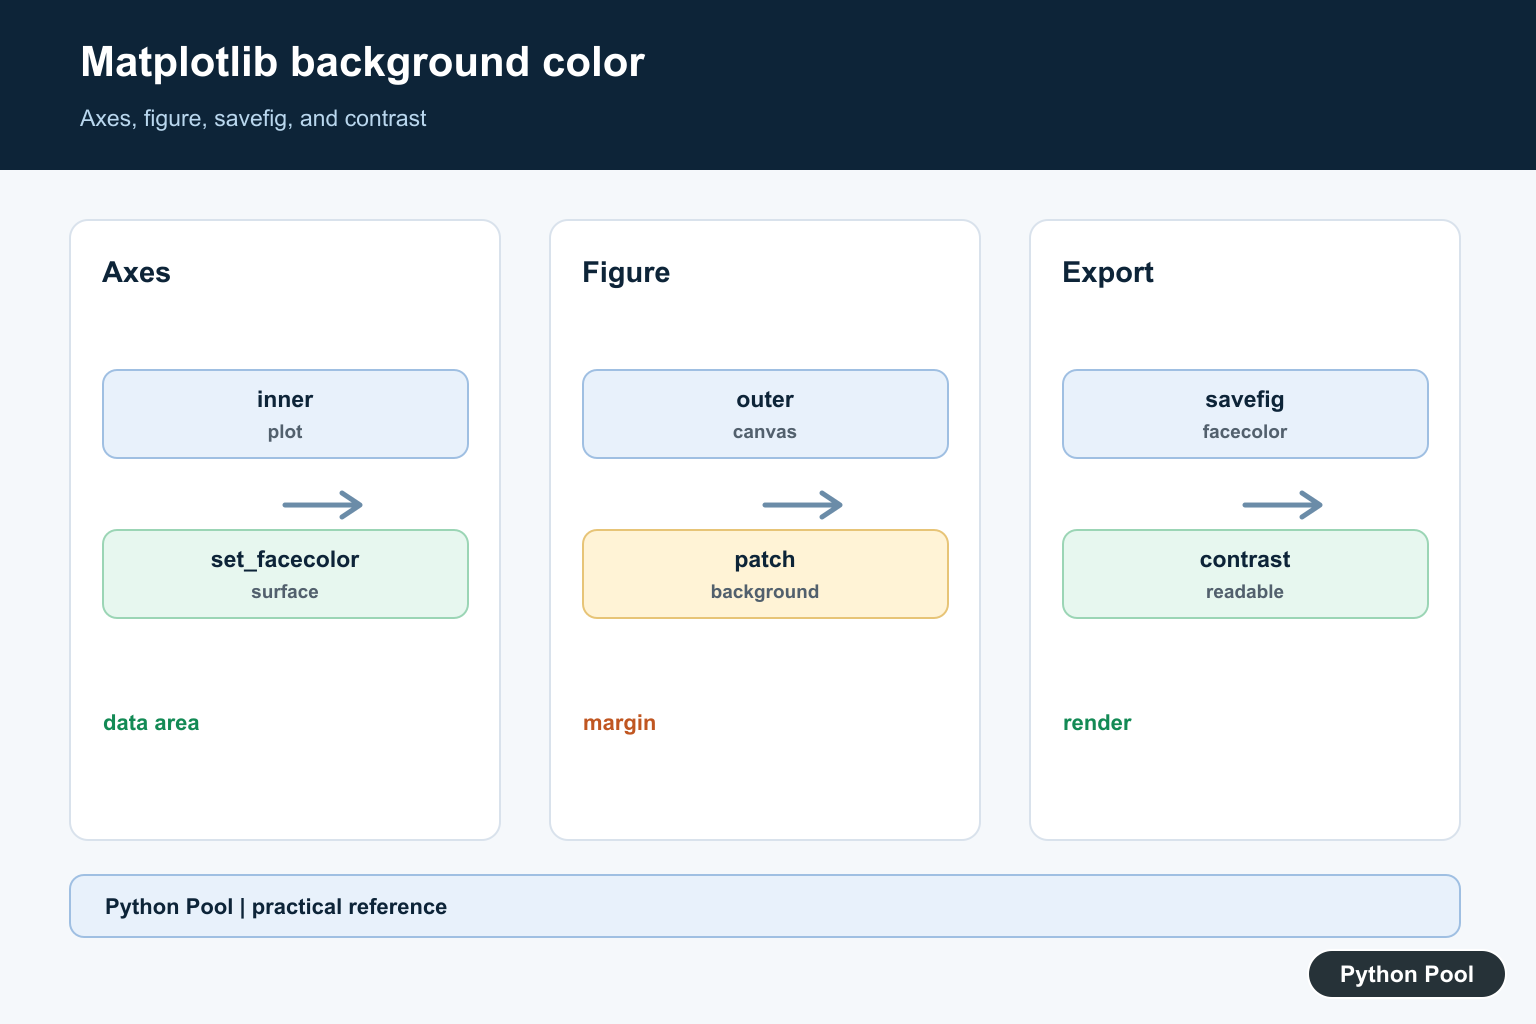
To change the background color of a Matplotlib plot, set the axes face color with ax.set_facecolor(). To change the outer area around the axes, set the figure face color with fig.set_facecolor() or pass facecolor when creating the figure.
The official Axes.set_facecolor() documentation describes it as setting the face color of the axes. The official Figure.set_facecolor() documentation covers the same idea for the full figure.
Change the Plot Area Background
Use ax.set_facecolor() when you want to color only the plotting area inside the axes:
import matplotlib.pyplot as plt

marks = [50, 60, 70, 80, 90]
grades = [2.0, 2.4, 3.0, 3.4, 4.0]

fig, ax = plt.subplots()
ax.plot(marks, grades, marker="o")

ax.set_title("Student grades")
ax.set_xlabel("Marks")
ax.set_ylabel("Grade points")
ax.set_facecolor("#eaf3ff")

plt.show()
This changes the inner plot area. It does not change the margin area around the axes.
Change the Figure Background
Use fig.set_facecolor() when you want to change the outer figure background:
import matplotlib.pyplot as plt

marks = [50, 60, 70, 80, 90]
grades = [2.0, 2.4, 3.0, 3.4, 4.0]

fig, ax = plt.subplots()
fig.set_facecolor("#f6f2e8")

ax.plot(marks, grades, marker="o")
ax.set_title("Figure background")

plt.show()
You can also set the figure background when creating the figure. The pyplot.figure() documentation includes facecolor as a figure creation option.
fig, ax = plt.subplots(facecolor="#f6f2e8")Change Both Inner and Outer Backgrounds
Use both settings when you want the plot area and figure area to have different colors:
import matplotlib.pyplot as plt

x = [1, 2, 3, 4, 5]
y = [3, 5, 4, 7, 6]

fig, ax = plt.subplots(facecolor="#20232a")
ax.set_facecolor("#f4f7fb")

ax.plot(x, y, color="#1f77b4", linewidth=2)
ax.set_title("Inner and outer background colors")
ax.set_xlabel("x")
ax.set_ylabel("y")

plt.show()
If labels are hard to read on a dark figure background, set label and title colors too:
ax.title.set_color("white")
ax.xaxis.label.set_color("white")
ax.yaxis.label.set_color("white")
Save a Plot With the Background Color
When saving a plot, pass facecolor to savefig() if you want the exported image to keep a specific background. The official pyplot.savefig() documentation includes facecolor for the saved figure.
fig.savefig("grades.png", facecolor=fig.get_facecolor(), bbox_inches="tight")This is useful when the image will be used in a report, slide deck, or webpage where a transparent or default white background is not desired.
Named Colors and Hex Colors
Matplotlib accepts common color names such as lightgray, black, and white, as well as hex values such as #eaf3ff. Hex values are often better when you need consistent brand or theme colors.
| Goal | Method |
|---|---|
| Plot area background | ax.set_facecolor("#eaf3ff") |
| Figure background | fig.set_facecolor("#f6f2e8") |
| Creation-time figure color | plt.subplots(facecolor="...") |
| Saved image background | fig.savefig(..., facecolor=...) |
Make Text Readable on Dark Backgrounds
When the figure background is dark, change the text and tick colors too. The official Axes.tick_params() documentation includes a colors option that changes both tick and tick-label color.
fig, ax = plt.subplots(facecolor="#20232a")
ax.set_facecolor("#20232a")

ax.plot([1, 2, 3], [2, 5, 3], color="#61dafb")
ax.set_title("Dark background", color="white")
ax.set_xlabel("x", color="white")
ax.set_ylabel("y", color="white")
ax.tick_params(colors="white")
Common Mistakes
- Calling
plt.axes()after plotting can create or switch axes unexpectedly. Preferfig, ax = plt.subplots(). - Changing the axes background does not automatically change the saved figure background.
- Dark figure backgrounds often need light title, label, and tick colors.
- Use accessible contrast when choosing background and line colors.
Change The Axes Facecolor
The Axes is the region containing data, ticks, grid lines, and labels. ax.set_facecolor(color) changes that inner surface without necessarily changing the surrounding figure. Use a named color, hex value, RGB tuple, or another supported Matplotlib color specification.
Change The Figure Patch
The Figure is the complete canvas around one or more Axes. fig.patch.set_facecolor(color) changes the outer background, while each Axes can retain its own facecolor. This distinction matters when subplots, margins, legends, or annotations extend outside the data region.
Keep Interactive And Saved Output Consistent
savefig() can override the apparent background through facecolor, edgecolor, or transparent settings. Pass the intended values when exporting and inspect the actual PNG or other output; a notebook preview is not proof that the saved file has the same surface.
Maintain Contrast
A dark background requires readable text, tick labels, spines, legends, grid lines, and annotation colors. Choose contrast as a system rather than changing only the patch color, and test the result at the final display size and in grayscale when accessibility matters.
Style Multiple Axes Consistently
When a figure contains subplots, set the facecolor on each Axes or apply a deliberate style loop rather than assuming the first Axes controls the others. Colorbars, inset axes, twin axes, and legends can have their own artists and may need explicit treatment. Record the palette beside the plotting code so a new subplot does not silently use a default surface.
Use rcParams For Repeated Styles
Set rcParams or a style context when many figures share a theme, but keep local overrides visible for one-off plots. Test that a style context is restored after use so a background choice does not leak into unrelated charts or library code.
Test The Rendered File
Create a figure with known axes and figure colors, save it with the intended facecolor and transparency, then inspect metadata or sample pixels in a controlled test. Check multiple subplots, legends, tight_layout or constrained_layout, and transparent output when those features are part of the workflow. Verify the file after reopening it rather than relying on the interactive backend, because rendering backends can apply different defaults.
The official Axes.set_facecolor reference, Figure patch reference, and savefig reference document the separate surfaces and export options. Related guidance includes image arrays and render tests.
For related figure styling, compare savefig output, layout control, and colorbars when checking a background across the full rendered figure.
Frequently Asked Questions
How do I change the Matplotlib plot background?
Call ax.set_facecolor(color) to change the axes region behind plotted data.
How do I change the whole figure background?
Call fig.patch.set_facecolor(color), and set the axes facecolor separately if the inner plot area should match.
Why does the saved background look different?
savefig() can use its own facecolor and edgecolor settings; pass them deliberately and check whether transparent output is enabled.
How do I keep text readable on a dark background?
Set text, tick, spine, legend, and grid colors with sufficient contrast, then inspect both the interactive figure and the saved file.
