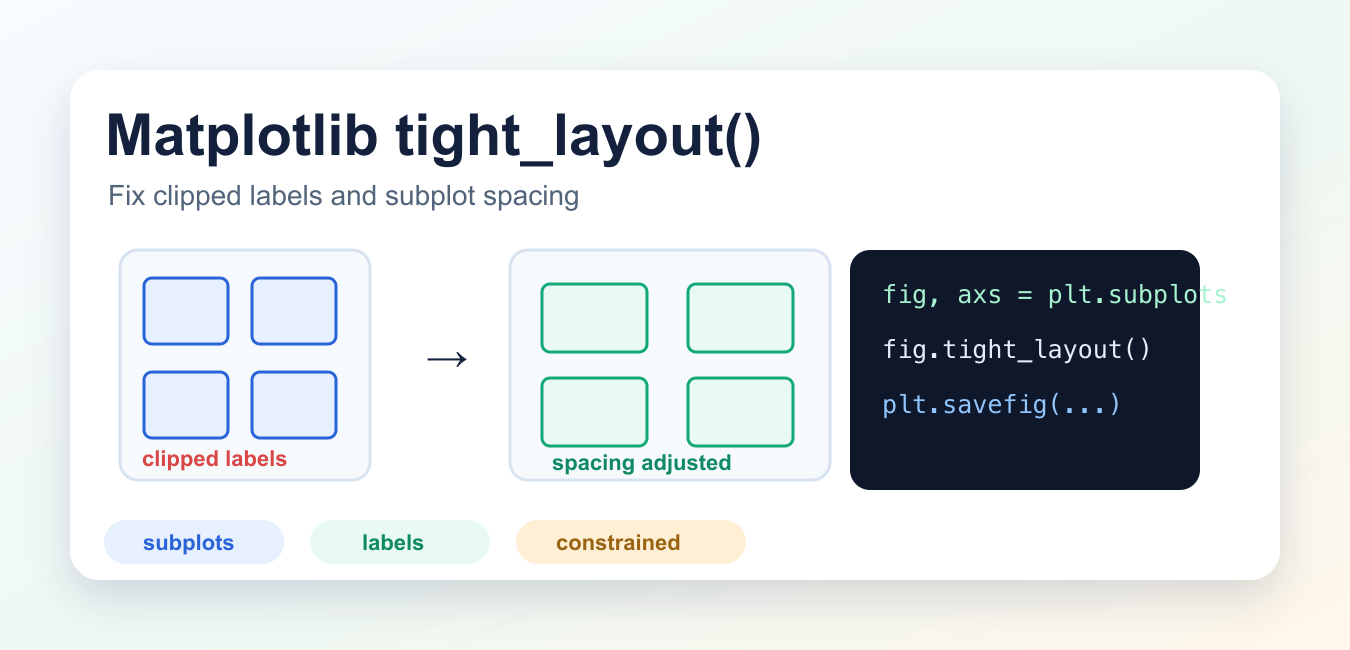
Quick answer: Use fig.tight_layout() to adjust subplot spacing for labels and titles, then inspect the result after saving. Tune pad, h_pad, w_pad, or rect when the default leaves too much space or clips content; use constrained layout when it better matches the figure structure.
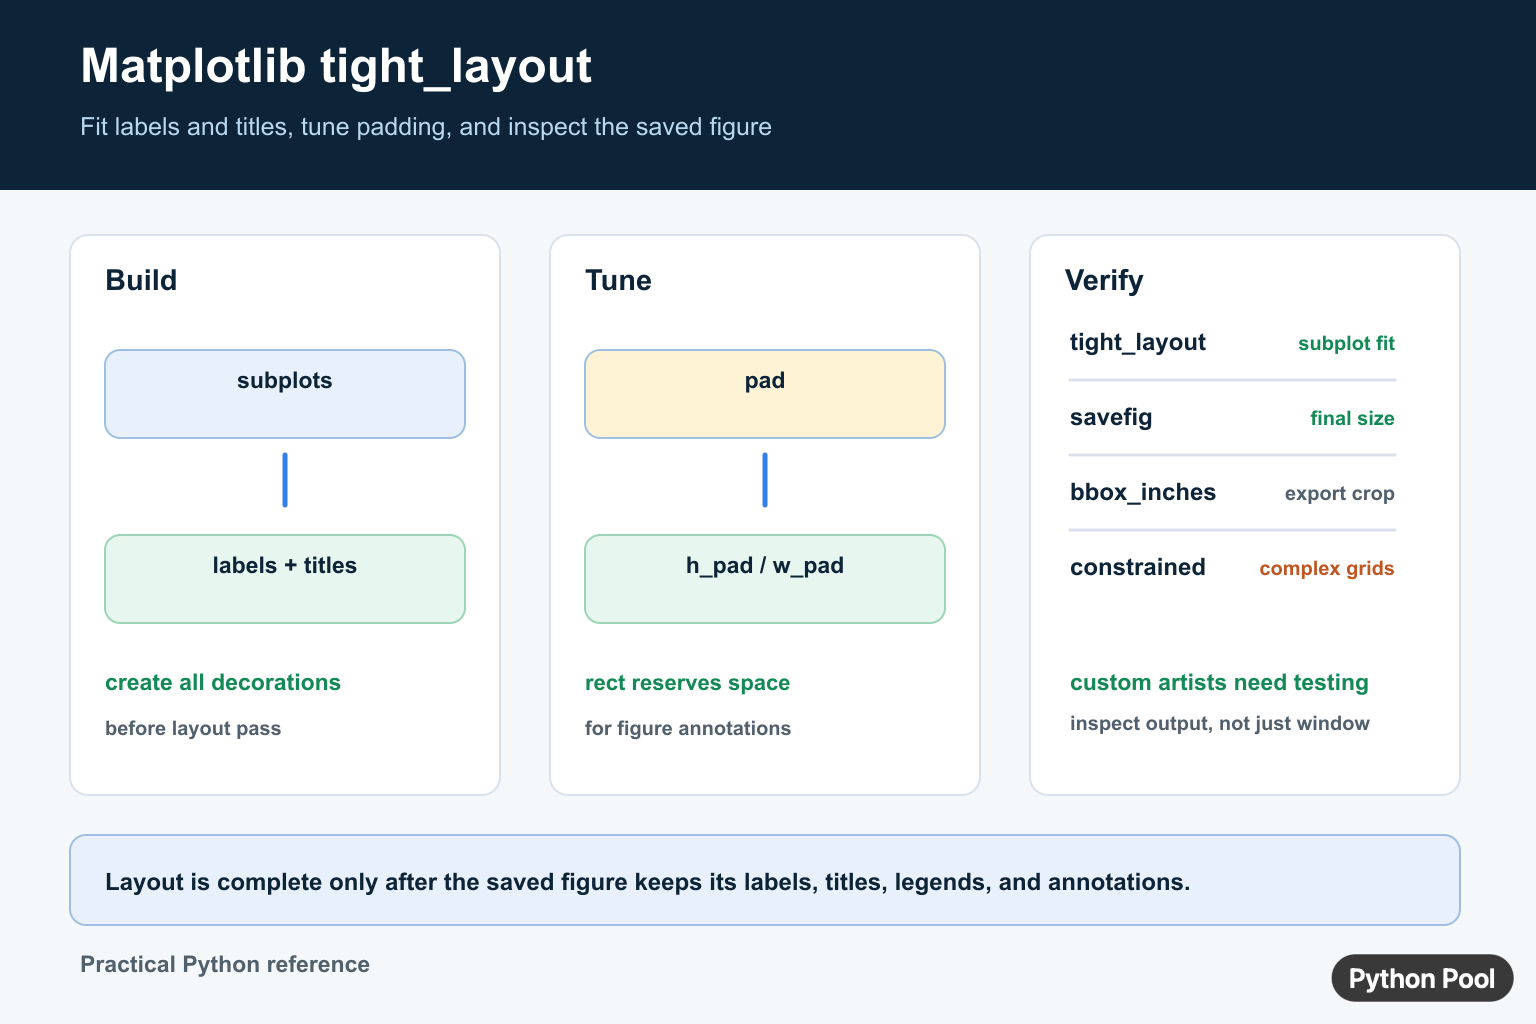
matplotlib.tight_layout() adjusts subplot spacing so tick labels, axis labels, and titles fit inside the figure. It is useful when subplots overlap, labels are clipped, or a saved image cuts off text around the edges.
In current Matplotlib code, use fig.tight_layout() when you are working with a Figure object. The pyplot shortcut plt.tight_layout() also works, but the Figure method is clearer in scripts with multiple figures.
Basic Example
Call tight_layout() after creating the subplots and adding labels or titles.
import matplotlib.pyplot as plt

fig, axs = plt.subplots(2, 2)

for ax in axs.flat:
    ax.plot([1, 2, 3], [1, 4, 9])
    ax.set_xlabel("Long x-axis label")
    ax.set_ylabel("Long y-axis label")
    ax.set_title("Subplot title")

fig.tight_layout()
plt.show()
The layout engine calculates extra space around each Axes so common text elements do not collide.
tight_layout Parameters
fig.tight_layout(pad=1.08, h_pad=None, w_pad=None, rect=None)| Parameter | Purpose |
|---|---|
pad |
Padding between the figure edge and subplot area, as a fraction of font size. |
h_pad |
Vertical padding between subplot rows. |
w_pad |
Horizontal padding between subplot columns. |
rect |
Rectangle in normalized figure coordinates where the subplots should fit. |
Use h_pad and w_pad when subplot rows or columns still feel cramped after the default adjustment.
Adjust Spacing Manually
fig.tight_layout(pad=1.5, h_pad=2.0, w_pad=1.2)Increasing pad leaves more room around the outside of the figure. Increasing h_pad or w_pad adds space between subplots.
Reserve Space With rect
If the figure has a suptitle or another object near the edge, reserve part of the figure before applying the layout.
fig, axs = plt.subplots(2, 2)
fig.suptitle("Experiment summary")

# Leave room for the suptitle at the top.
fig.tight_layout(rect=(0, 0, 1, 0.95))
The rect tuple means left, bottom, right, top in normalized figure coordinates.
Use tight_layout Before Saving
When exporting a chart, apply the layout before savefig().
fig.tight_layout()
fig.savefig("plot.png", dpi=150)
If text is still clipped in the saved file, bbox_inches="tight" can help during export, but it is separate from tight_layout().
tight_layout With Legends and Annotations
tight_layout() handles many normal labels and titles, but legends, annotations, colorbars, and custom artists can still need manual adjustment. If an artist should not be included in layout calculations, Matplotlib artists support set_in_layout(False).
legend = ax.legend(loc="center left", bbox_to_anchor=(1, 0.5))
legend.set_in_layout(False)
fig.tight_layout()
For annotation-specific examples, see the Matplotlib annotate guide.
tight_layout vs constrained_layout
tight_layout() is a one-shot adjustment. It checks the sizes of visible labels, titles, and tick labels, then changes subplot parameters. Matplotlib’s constrained layout is a newer layout engine designed for more complex figures and can handle many grids, colorbars, legends, and nested layouts more naturally.
For new figures with complex layouts, try constrained layout first:
fig, axs = plt.subplots(2, 2, layout="constrained")Use tight_layout() when you want a quick explicit adjustment, especially in simple subplot grids.
When tight_layout Is Not Enough
tight_layout() is not a full page-layout system. It is best for straightforward grids of subplots with normal tick labels, titles, and axis labels. If the figure has nested grids, multiple colorbars, manually positioned Axes, or legends outside the plot area, constrained layout usually gives a better starting point.
Also remember that tight_layout() does not permanently change the data, axes limits, or plotted artists. It only changes subplot spacing. If a label looks wrong because the font size is too large, the figure is too small, or the legend is placed far outside the Axes, you still need to adjust those choices directly.
Common Problems
- Labels are still clipped: Increase
pad, usebbox_inches="tight"when saving, or switch to constrained layout. - Legends outside the Axes shrink the plot: Move the legend, exclude it with
set_in_layout(False), or reserve space withrect. - Subplots are too close together: Use
h_padandw_pad. - Layout changes the wrong figure: Prefer
fig.tight_layout()instead of relying on the current pyplot figure.
Related Matplotlib Guides
Spacing problems often appear alongside labels and axes configuration. See Matplotlib vertical lines, Matplotlib ylim, Matplotlib gca(), Matplotlib background color, and clear a Matplotlib plot.
Official References
- Matplotlib pyplot.tight_layout documentation
- Matplotlib Figure.tight_layout documentation
- Matplotlib tight layout guide
- Matplotlib constrained layout guide
Conclusion
fig.tight_layout() is a practical fix for crowded Matplotlib figures. Use it after adding labels and titles, tune pad, h_pad, w_pad, or rect when needed, and consider constrained layout for complex figures.
Use tight_layout After Building The Figure
tight_layout() calculates subplot parameters from the decorations Matplotlib knows about, such as tick labels, axis labels, and titles. Call it after creating the axes and labels, not before the figure has its final text. It is a layout adjustment, not a guarantee that every custom artist or external annotation will fit.
import matplotlib.pyplot as plt

fig, axes = plt.subplots(1, 2, figsize=(8, 3))
axes[0].set_title("Training")
axes[0].set_xlabel("Epoch")
axes[1].set_title("Validation")
axes[1].set_ylabel("Loss")

fig.tight_layout(pad=1.0)
fig.savefig("loss-curves.png", dpi=160, bbox_inches="tight")
Tune pad, h_pad, w_pad, And rect
pad controls the overall padding as a fraction of the font size. Use h_pad and w_pad when vertical or horizontal gaps need separate treatment. rect reserves a normalized rectangle for the subplots, which helps when a figure-level title or a side annotation needs space.
When tight_layout Is Not Enough
Legends placed outside axes, manually positioned text, colorbars, and unusual artists may not participate in the calculation as you expect. Test the saved file at its final size rather than trusting only an interactive window. For complex grids, compare constrained_layout=True and keep the approach that produces the most stable result for your target backends.
Frequently Asked Questions
What does tight_layout() do in Matplotlib?
It adjusts subplot parameters to fit known decorations such as axis labels, tick labels, and titles.
How do I add space between Matplotlib subplots?
Tune pad for overall spacing and h_pad or w_pad for vertical or horizontal gaps, then inspect the result at the target figure size.
Why does tight_layout still clip my legend or annotation?
Custom artists or objects outside the axes may not participate as expected, so test the saved output and adjust the layout or bounding box.
Should I use tight_layout or constrained_layout?
Compare both for the figure structure; constrained layout can be more stable for complex grids, while tight_layout remains useful for explicit post-build adjustment.
