
Quick answer: Matplotlib savefig exports the current figure to a file. Configure labels, layout, and figure size before saving, choose a format from the filename or format argument, and set dpi, transparent, facecolor, or bbox_inches deliberately for the destination. For reliable automation, save to an explicit path and close the figure after the bytes are written.
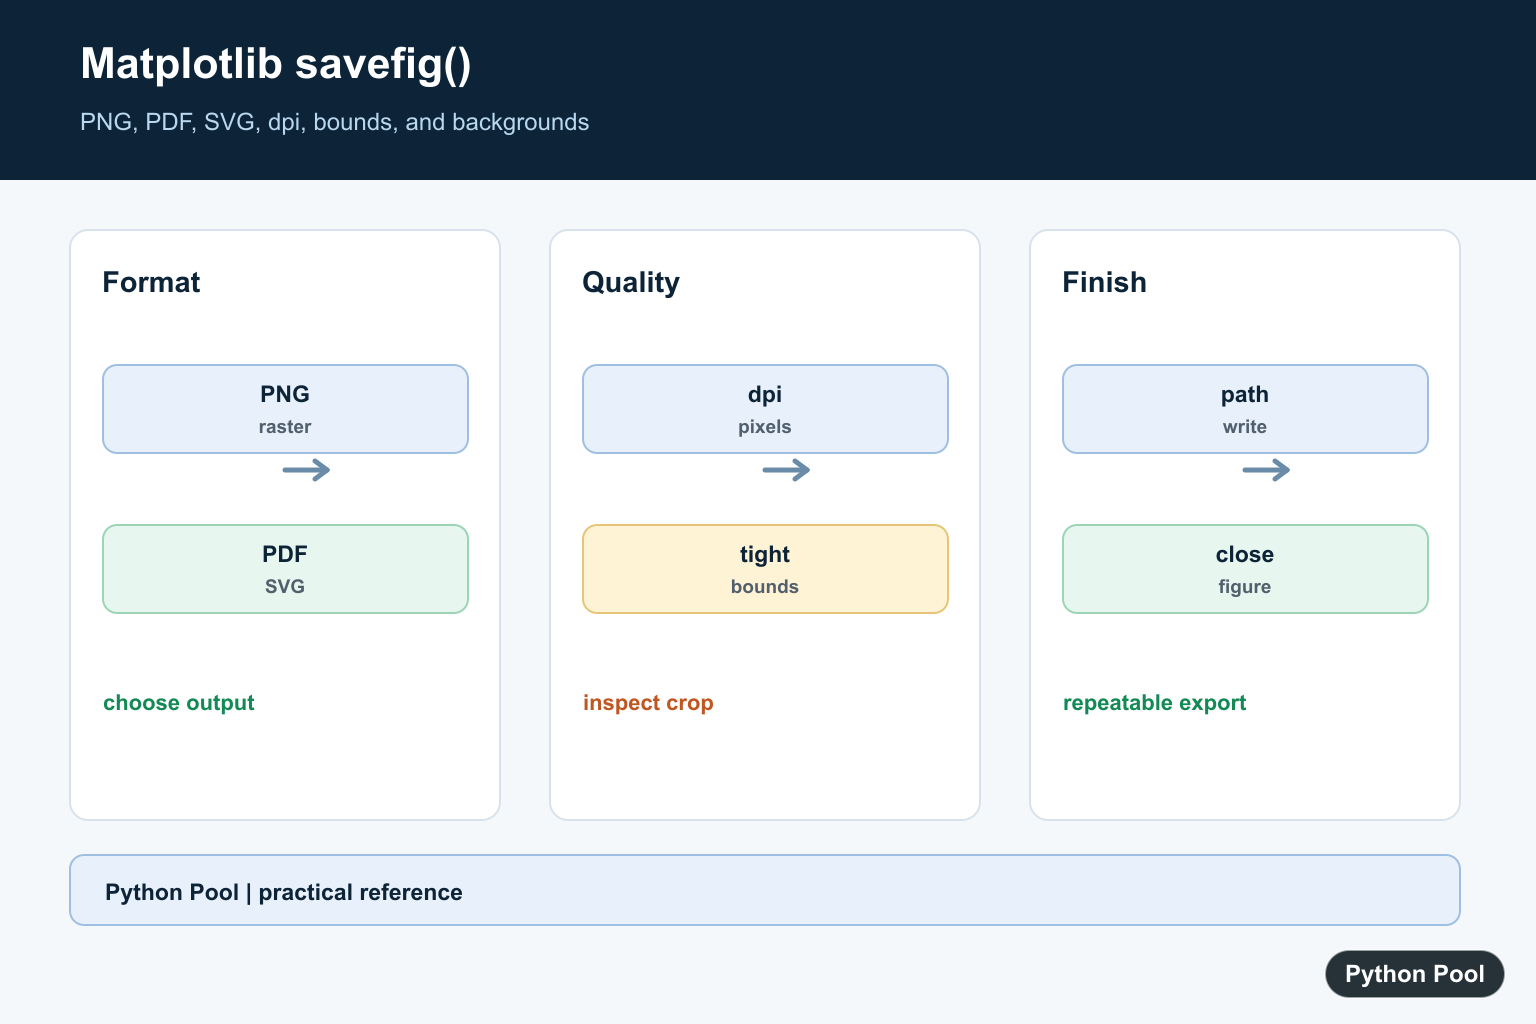
Matplotlib savefig() exports a figure to a file or file-like object. It is the function you use when a plot should become a PNG for a blog post, a PDF for a report, an SVG for a vector graphic, or an in-memory image for a web response.
The most reliable pattern is to keep a reference to the figure and call fig.savefig(). plt.savefig() also works, but it saves the current active figure. In scripts with more than one figure, the explicit fig.savefig() form is easier to read and less error-prone.
Basic savefig example
Create the plot, set labels and titles, then save the figure before or instead of showing it. The filename extension usually tells Matplotlib which output format to use.
import matplotlib.pyplot as plt

fig, ax = plt.subplots()
ax.plot([1, 2, 3], [2, 4, 3])
ax.set_title("Line chart")
ax.set_xlabel("X")
ax.set_ylabel("Y")

fig.savefig("line-chart.png")
This saves line-chart.png in the current working directory. For simple scripts, that is enough. For reusable code, pass a full path so the output location is explicit. If you are building the chart itself, related guides such as Matplotlib grid and Matplotlib 2D histogram cover common plot setup before export.
Set image quality with dpi
The dpi argument controls dots per inch for raster formats such as PNG. A higher DPI creates a larger pixel image and is useful for print or high-resolution screenshots.
fig.savefig("line-chart-300dpi.png", dpi=300)For web images, 120 to 200 DPI is often enough if the figure size is reasonable. For print, 300 DPI is a common target. DPI does not affect vector formats such as SVG in the same way because vectors scale without fixed pixels.
Remove extra whitespace with bbox_inches
If a saved image has too much margin or cuts off labels, use bbox_inches="tight". It asks Matplotlib to calculate a tighter bounding box around the visible artists.
fig.savefig(
    "line-chart-tight.png",
    dpi=300,
    bbox_inches="tight",
)
This is especially useful when the plot has long tick labels, rotated labels, legends, or annotations. If the layout itself needs adjustment before saving, see Matplotlib tight_layout() and Matplotlib subplot spacing. If only the axis tick text needs cleanup, use Matplotlib xticks before exporting.
Save as PNG, PDF, or SVG
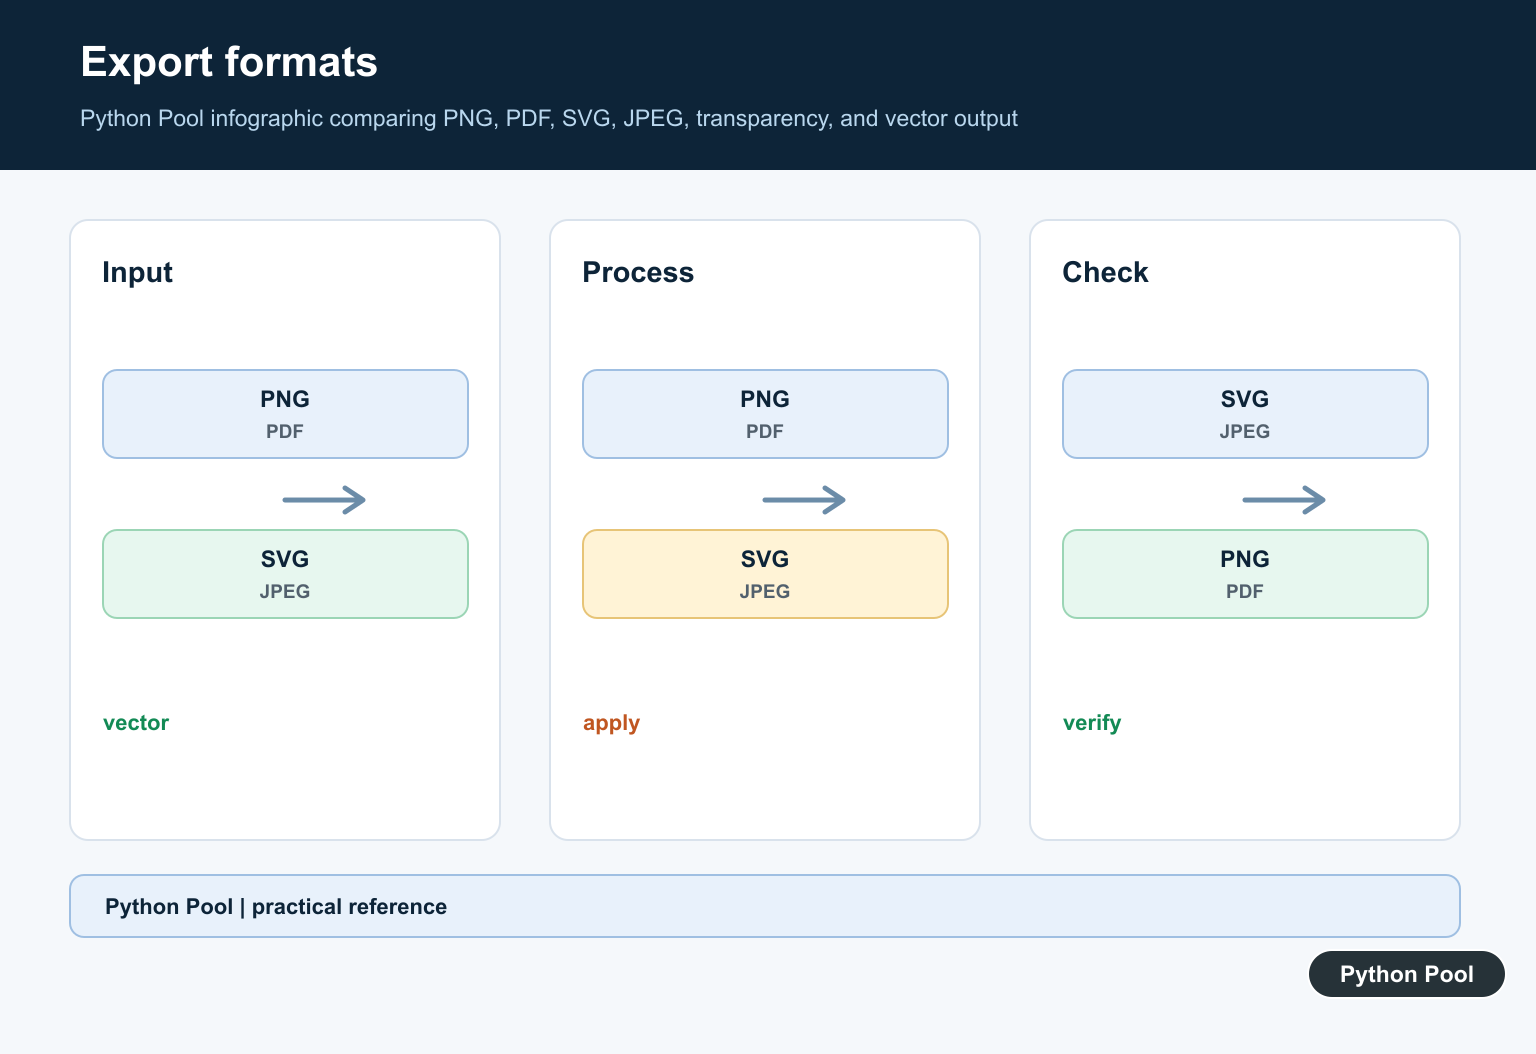
Matplotlib chooses the format from the filename extension in most cases. Use PNG for raster images, PDF for reports, and SVG when you need editable vector graphics.
fig.savefig("chart.png", dpi=200)
fig.savefig("chart.pdf")
fig.savefig("chart.svg")
You can also pass format="png", format="pdf", or another supported format when saving to a file-like object or when the filename does not contain an extension.
Transparent and custom backgrounds
Use transparent=True when the figure should sit on top of a web page, slide deck, or design with its own background. You can also control the figure face color when you want the exported file to keep a specific background.
fig.savefig(
    "plot-transparent.png",
    transparent=True,
    dpi=300,
    bbox_inches="tight",
)
If the plot background is part of the design, set it intentionally before saving. The guide to Matplotlib background color covers that styling step.
Save to memory with BytesIO
savefig() can write to a file-like object. This is useful in web apps, notebooks, APIs, and tests where you do not want to create a temporary file on disk.
from io import BytesIO

buffer = BytesIO()
fig.savefig(buffer, format="png", dpi=150)
buffer.seek(0)

image_bytes = buffer.getvalue()
When saving to memory, pass format explicitly because there may be no filename extension. This pattern is also useful when returning an image from a Flask or Django view.
Figure size vs saved image size
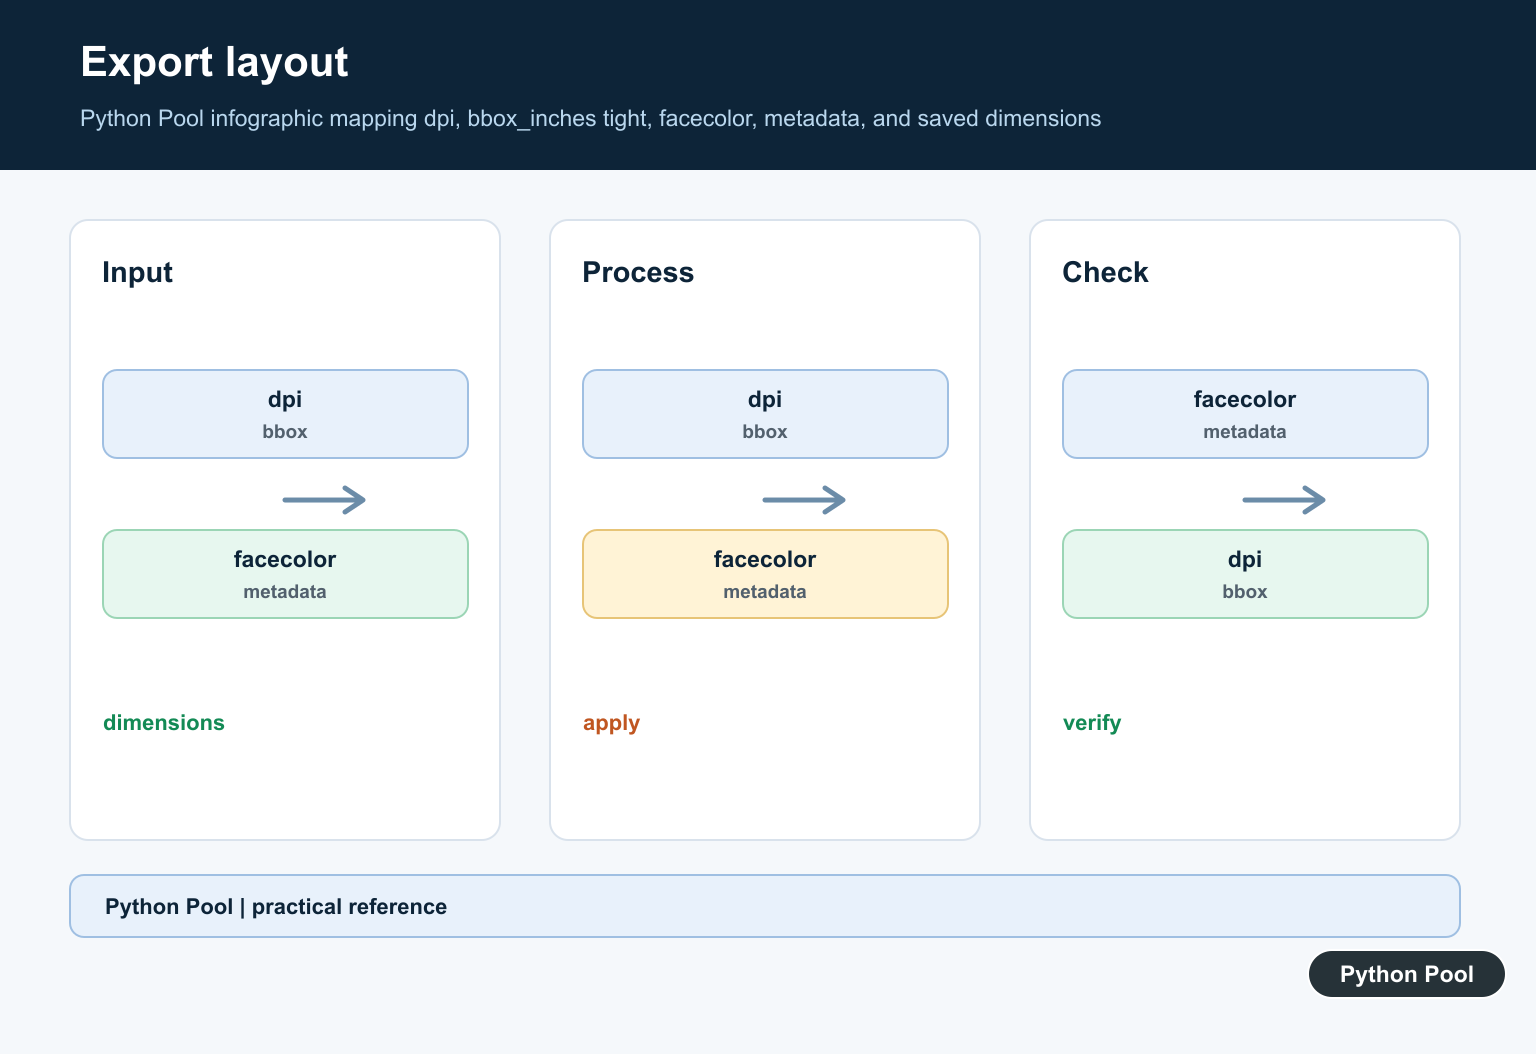
Figure size and DPI work together. A figure that is 6 inches wide saved at 200 DPI becomes 1200 pixels wide. Set the figure size before plotting when the final dimensions matter.
fig, ax = plt.subplots(figsize=(6, 4))
ax.plot([1, 2, 3], [2, 4, 3])
fig.savefig("six-by-four.png", dpi=200)
For a deeper explanation of figure dimensions, read Matplotlib figsize. If the axes geometry is custom, Matplotlib GridSpec can help define the layout before export.
Common savefig mistakes
Do not call plt.savefig() after accidentally creating or activating another figure. Prefer fig.savefig() when a script creates multiple figures. Do not rely on the current working directory in production code; save to a known path. Do not use a very high DPI as a layout fix. If labels overlap, fix the layout first, then export.
Also check the output file after changing formats. PNG, PDF, and SVG handle text, transparency, and embedded metadata differently. A figure that is perfect as a PNG may need a different font or layout setting as a PDF.
Official Matplotlib references
- pyplot.savefig documentation
- Figure.savefig documentation
- Matplotlib backends guide
- pyplot.figure documentation
- pyplot.subplots documentation
- Tight layout guide
- Constrained layout guide
- Figure.set_size_inches documentation
Save A Figure To A Known Path
Figure.savefig is explicit and works well in scripts that may create more than one figure. Create the output directory first, use a filename extension that communicates the format, and keep the returned artifact path in your result record.
from pathlib import Path
import matplotlib.pyplot as plt

output = Path("artifacts")
output.mkdir(exist_ok=True)
fig, ax = plt.subplots()
ax.plot([1, 2, 3], [2, 4, 3])
path = output / "trend.png"
fig.savefig(path, dpi=160)
plt.close(fig)
print(path.resolve())
Choose PNG, PDF, Or SVG
PNG is a raster image suitable for many web and report workflows, while PDF and SVG preserve vector geometry for documents or later design edits. Check the consuming system before selecting a format and embed fonts or metadata only when the workflow requires it.
import matplotlib.pyplot as plt

fig, ax = plt.subplots()
ax.plot([0, 1, 2], [0, 1, 4])
for extension in ("png", "pdf", "svg"):
    fig.savefig(f"plot.{extension}")
plt.close(fig)
Control Resolution And Bounds
dpi controls raster resolution, not the physical meaning of a vector PDF or SVG. bbox_inches=’tight’ can remove excess whitespace, but inspect legends, annotations, and suptitles because artists outside the axes may affect the crop.
import matplotlib.pyplot as plt

fig, ax = plt.subplots(figsize=(6, 4))
ax.plot([1, 2, 3], [1, 4, 2], label="series")
ax.legend()
fig.savefig("plot-tight.png", dpi=220, bbox_inches="tight", pad_inches=0.12)
plt.close(fig)
Handle Transparency And Background
Transparent output is useful when a plot is placed on another surface, but it can look wrong in viewers that assume a white background. Set facecolor when the image should have a stable background and verify the result at its actual display size.
import matplotlib.pyplot as plt

fig, ax = plt.subplots(facecolor="#f5f8fb")
ax.set_facecolor("#f5f8fb")
ax.bar(["A", "B"], [3, 5])
fig.savefig("plot-background.png", dpi=180, facecolor=fig.get_facecolor())
plt.close(fig)
Matplotlib documents Figure.savefig() and its format, dpi, transparency, and bounding-box parameters. Related references include figure size, tight layout, and NumPy file export.
For related figure output, compare figure size, tight layout, and NumPy file export when choosing an artifact format.
Frequently Asked Questions
How do I save a Matplotlib figure?
Call fig.savefig(path) or plt.savefig(path) after creating and configuring the figure.
How do I save a high-resolution PNG?
Use a suitable dpi such as 200 or 300 and verify the resulting pixel dimensions at the intended display size.
What does bbox_inches tight do?
It trims the saved bounding box around the artists, which can prevent excess whitespace but should be checked with annotations and legends.
Which format should I use for plots?
PNG is convenient for raster images, PDF is useful for documents, and SVG preserves vector geometry for web or design workflows.
