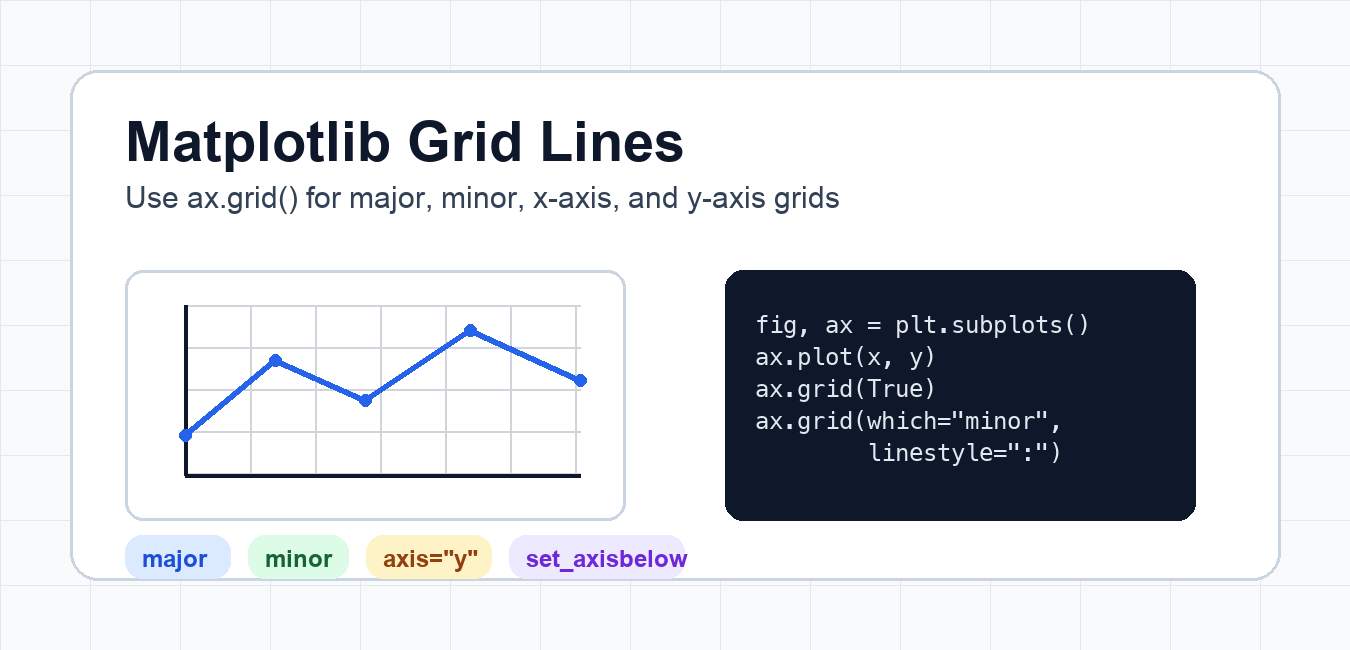
Quick answer: Use ax.grid(True) to show grid lines, then choose axis, which, color, linestyle, linewidth, and alpha. Enable minor ticks separately when you want a minor grid, and use axisbelow to control whether the grid sits behind plotted artists.
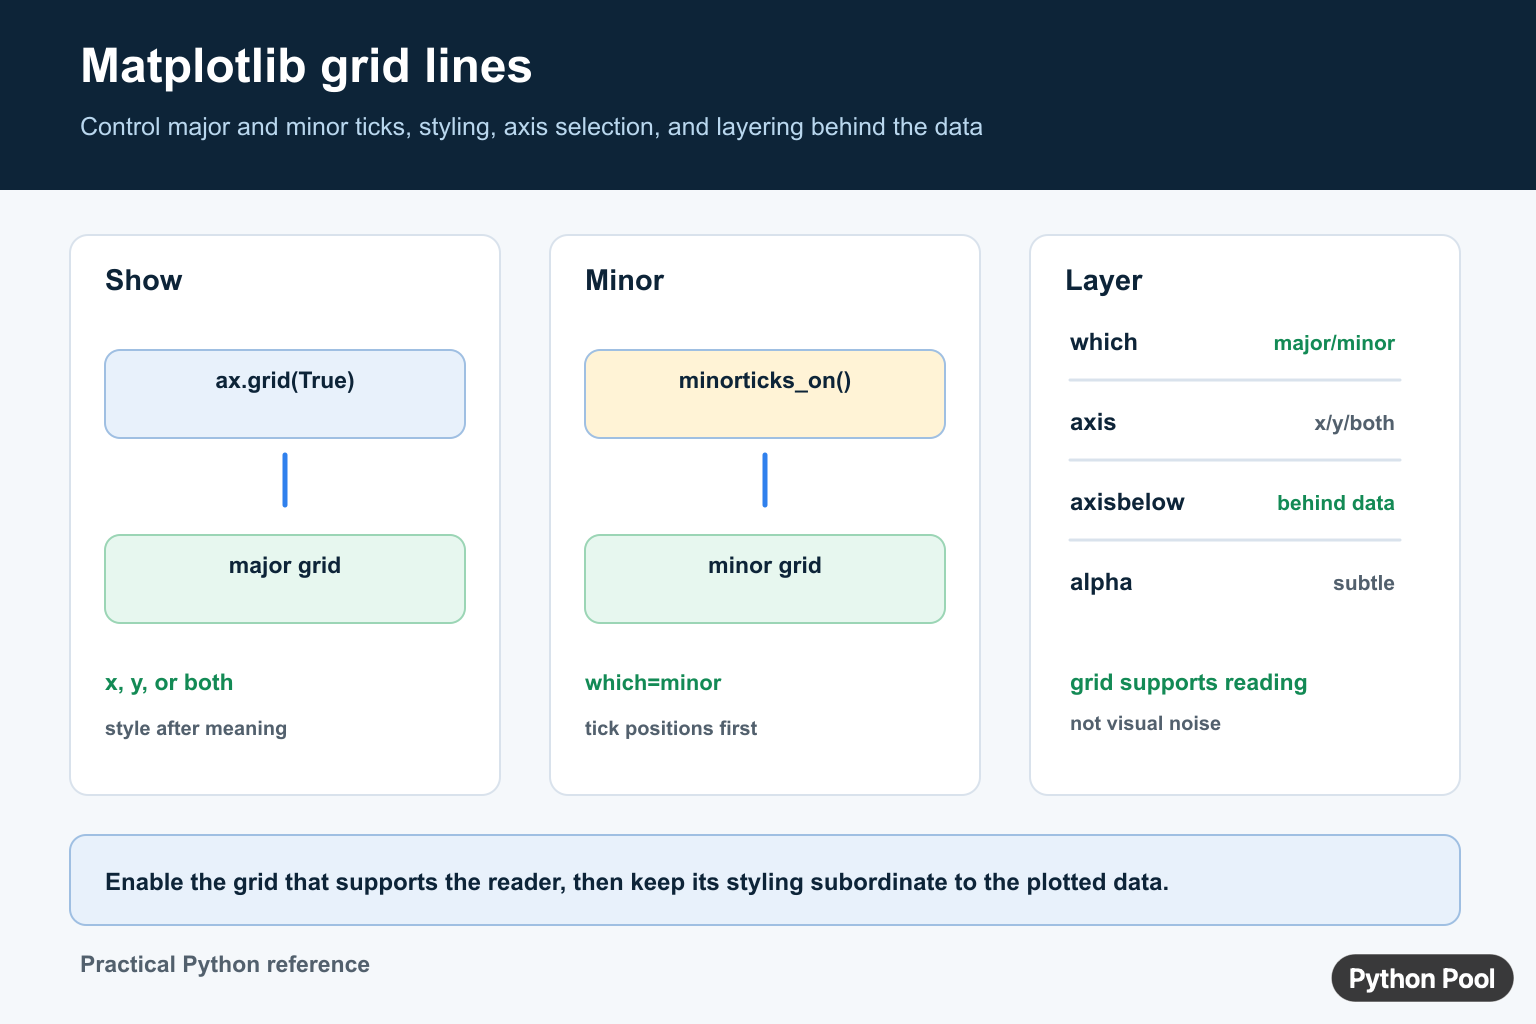
Matplotlib grid lines make plots easier to read by giving the eye a reference for x and y values. In modern Matplotlib code, prefer the object-oriented API: create a figure and axes with plt.subplots(), then call ax.grid() on the axes you want to control.
The examples below were tested with Matplotlib 3.11.0 using the non-interactive Agg backend. They focus on common grid tasks: turning grids on, styling lines, showing only one axis, using minor grid lines, and keeping bars or lines above the grid.
Basic Matplotlib grid example
Call ax.grid(True) to show major grid lines on both axes. This is the simplest and clearest version for most line charts.
<div class="pythonpool-code-scroll" style="max-width:100%;overflow-x:auto;-webkit-overflow-scrolling:touch;">import matplotlib.pyplot as plt

x = [1, 2, 3]
y = [2, 4, 3]

fig, ax = plt.subplots()
ax.plot(x, y, marker="o")
ax.grid(True)

plt.show()</div>
If you are using multiple subplots, call grid() on each axes object that needs grid lines. That keeps the behavior explicit and avoids accidental changes to the wrong plot.
Style grid color, width, and line style
grid() accepts line styling keyword arguments. Use light colors and modest line widths so the grid supports the data instead of overpowering it.
<div class="pythonpool-code-scroll" style="max-width:100%;overflow-x:auto;-webkit-overflow-scrolling:touch;">fig, ax = plt.subplots()
ax.plot([1, 2, 3], [2, 4, 3], color="tab:blue")
ax.grid(True, color="0.85", linestyle="--", linewidth=1.0)

plt.show()</div>
The color="0.85" value is a grayscale shortcut. You can also use named colors, hex colors, or RGB tuples.
Show grid lines on only one axis
Use the axis argument when you want grid lines only horizontally or vertically. For bar charts, a y-axis grid is often enough because it helps compare bar heights without cluttering the x-axis labels.
<div class="pythonpool-code-scroll" style="max-width:100%;overflow-x:auto;-webkit-overflow-scrolling:touch;">fig, ax = plt.subplots()
ax.bar(["A", "B"], [3, 5])
ax.grid(axis="y", linestyle="--", alpha=0.5)
ax.set_axisbelow(True)

plt.show()</div>
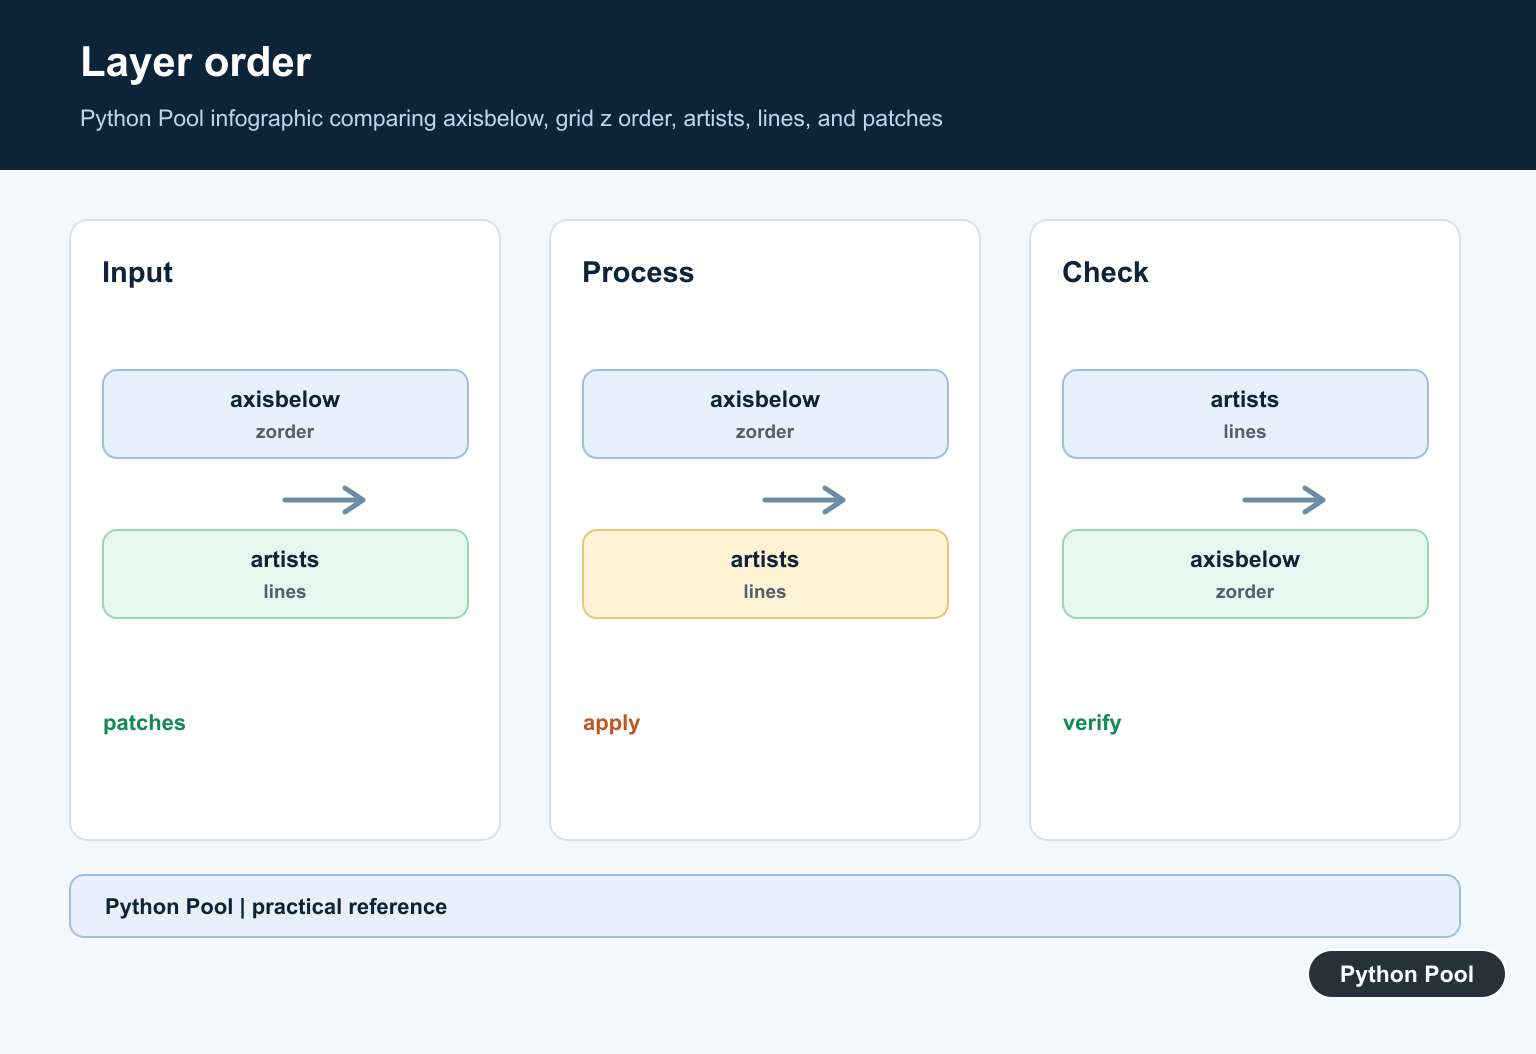
set_axisbelow(True) draws grid lines behind plot elements. This is usually what you want for bars, markers, and thick lines.
Major and minor grid lines
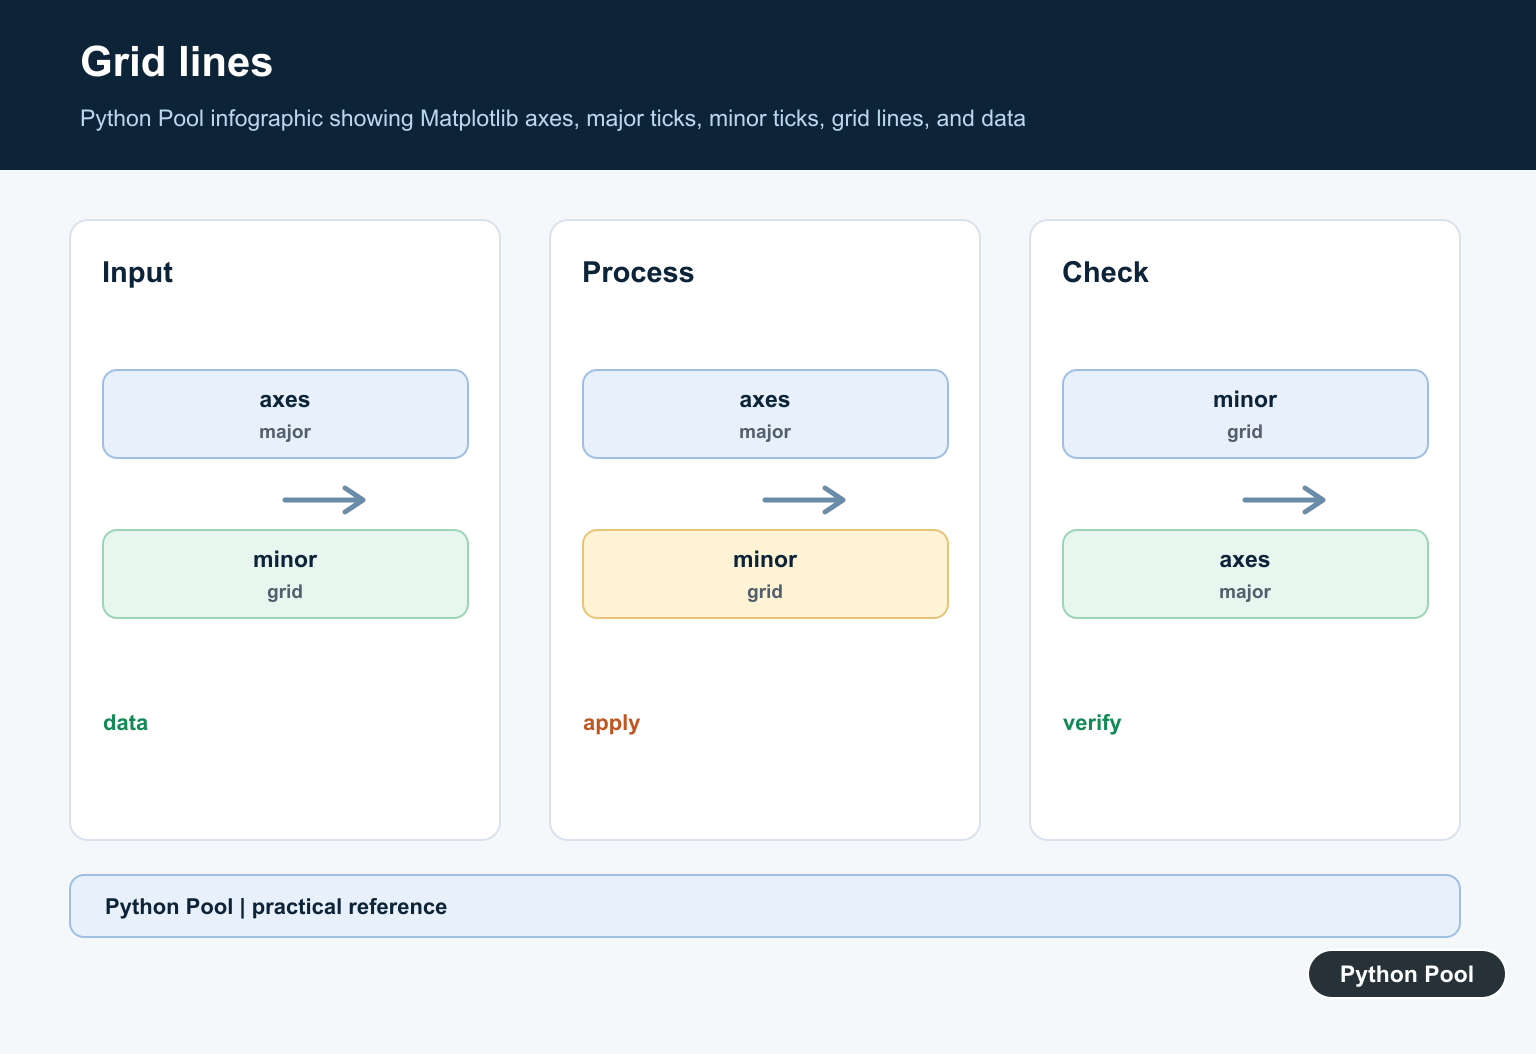
Major grid lines follow the major ticks. Minor grid lines follow minor ticks, which you can enable with minorticks_on(). Use a lighter style for minor lines so the chart stays readable.
<div class="pythonpool-code-scroll" style="max-width:100%;overflow-x:auto;-webkit-overflow-scrolling:touch;">fig, ax = plt.subplots()
ax.plot([1, 2, 3], [2, 4, 3])
ax.minorticks_on()
ax.grid(which="major", color="0.80", linewidth=1.0)
ax.grid(which="minor", color="0.90", linestyle=":", linewidth=0.6)

plt.show()</div>
pyplot.grid() versus ax.grid()
matplotlib.pyplot.grid() still works, but it acts on the current axes. That can be convenient in quick notebooks, but it is less explicit in scripts with multiple subplots. ax.grid() makes the target axes obvious and is easier to maintain.
Common grid mistakes
- Using grid lines that are darker than the plotted data.
- Calling
plt.grid()and accidentally changing the wrong subplot. - Turning on minor grid lines without enabling minor ticks.
- Letting grid lines draw over bars or markers instead of behind them.
- Using both x and y grids when one axis would be easier to read.
Grid lines should support the data
A grid is helpful when readers need to estimate values from the chart. It is less useful when the exact values are already labeled or when the plot has only a few points. If the grid competes with the line, markers, bars, or annotations, make it lighter or remove one axis of grid lines.
For dense charts, start with major grid lines only. Add minor grid lines only when they improve reading precision. A chart with both major and minor grid lines can quickly look noisy, especially on small screens.
Control ticks before adding a grid
Grid lines follow tick locations. If the grid looks too crowded or too sparse, adjust the ticks instead of trying to fix only the grid styling. Setting clear tick positions makes the grid predictable.
<div class="pythonpool-code-scroll" style="max-width:100%;overflow-x:auto;-webkit-overflow-scrolling:touch;">fig, ax = plt.subplots()
ax.plot([0, 1, 2], [0, 1, 4])
ax.set_xticks([0, 1, 2])
ax.set_yticks([0, 2, 4])
ax.grid(axis="both", color="0.85")
ax.set_axisbelow(True)</div>
Saving a plot with grid lines
Grid lines are part of the figure, so they are included when you save the chart with savefig(). Use a suitable DPI and file format for the destination. PNG works well for blog posts and dashboards, while SVG or PDF can be better for vector output.
<div class="pythonpool-code-scroll" style="max-width:100%;overflow-x:auto;-webkit-overflow-scrolling:touch;">fig.savefig("plot-with-grid.png", dpi=150, bbox_inches="tight")</div>
Troubleshooting Matplotlib grids
If the grid does not appear, confirm that you called grid() on the correct axes and that the grid color is not the same as the background. If minor grid lines do not appear, call minorticks_on() first. If the grid covers bars or markers, use set_axisbelow(True). If a subplot is missing a grid, remember that each axes object controls its own grid state.
Related Python guides
- Matplotlib linestyle
- Matplotlib vertical lines
- Matplotlib errorbar
- Matplotlib boxplot
- Matplotlib imread
- NumPy axis explained
Official references
- Matplotlib Axes.grid
- Matplotlib pyplot.grid
- Matplotlib Axes.minorticks_on
- Matplotlib Axes.set_axisbelow
- Matplotlib simple plot example
Turn Major And Minor Grids On
ax.grid() controls grid visibility and styling for an axes. The which argument selects major, minor, or both tick grids, while axis limits the change to x, y, or both directions. Minor grid lines require minor ticks to exist, so enable them with ax.minorticks_on() when needed.
import matplotlib.pyplot as plt

fig, ax = plt.subplots()
ax.plot([1, 2, 3], [2, 4, 3])
ax.minorticks_on()
ax.grid(which="major", color="#94a3b8", alpha=0.55)
ax.grid(which="minor", linestyle=":", alpha=0.35)
plt.show()
Keep Grid Styling Subordinate
Grid lines should help the reader estimate values without competing with the data. Use a lighter color or alpha for minor lines, keep line styles consistent, and label the axes so a grid intersection has meaning. Use axisbelow or ax.set_axisbelow(True) when the grid should sit behind bars, lines, or filled areas.
For saved figures, test the final size and contrast rather than judging only the interactive window. Dense minor grids can become noise on a small chart, while a sparse major grid may be enough for a report or dashboard.
Frequently Asked Questions
How do I show grid lines in Matplotlib?
Call ax.grid(True) or ax.grid() on the axes, then configure the color, linestyle, linewidth, alpha, and axis options.
How do I add minor grid lines?
Enable minor ticks with ax.minorticks_on() and call ax.grid(which=’minor’) with a lighter or subtler style.
What does axisbelow do?
axisbelow controls whether grid lines are drawn behind or in front of plotted artists such as lines, bars, and filled regions.
Can I show a grid only on one axis?
Yes. Pass axis=’x’ or axis=’y’ to target one direction, or use axis=’both’ for the default two-axis behavior.
