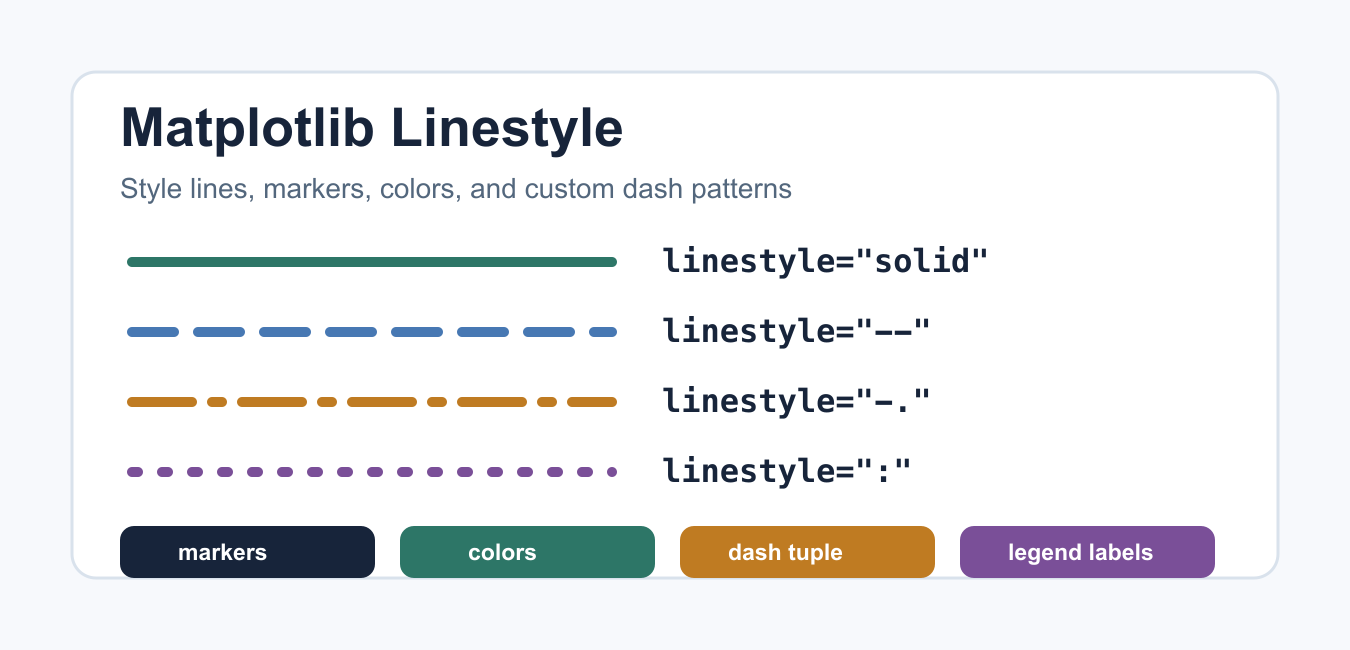
Quick answer: Set a Matplotlib line style with ‘-‘, ‘–‘, ‘:’, or ‘-.’, or pass a named style such as ‘dashed’. Combine linestyle with linewidth, color, alpha, and custom dash patterns to make plotted differences readable.
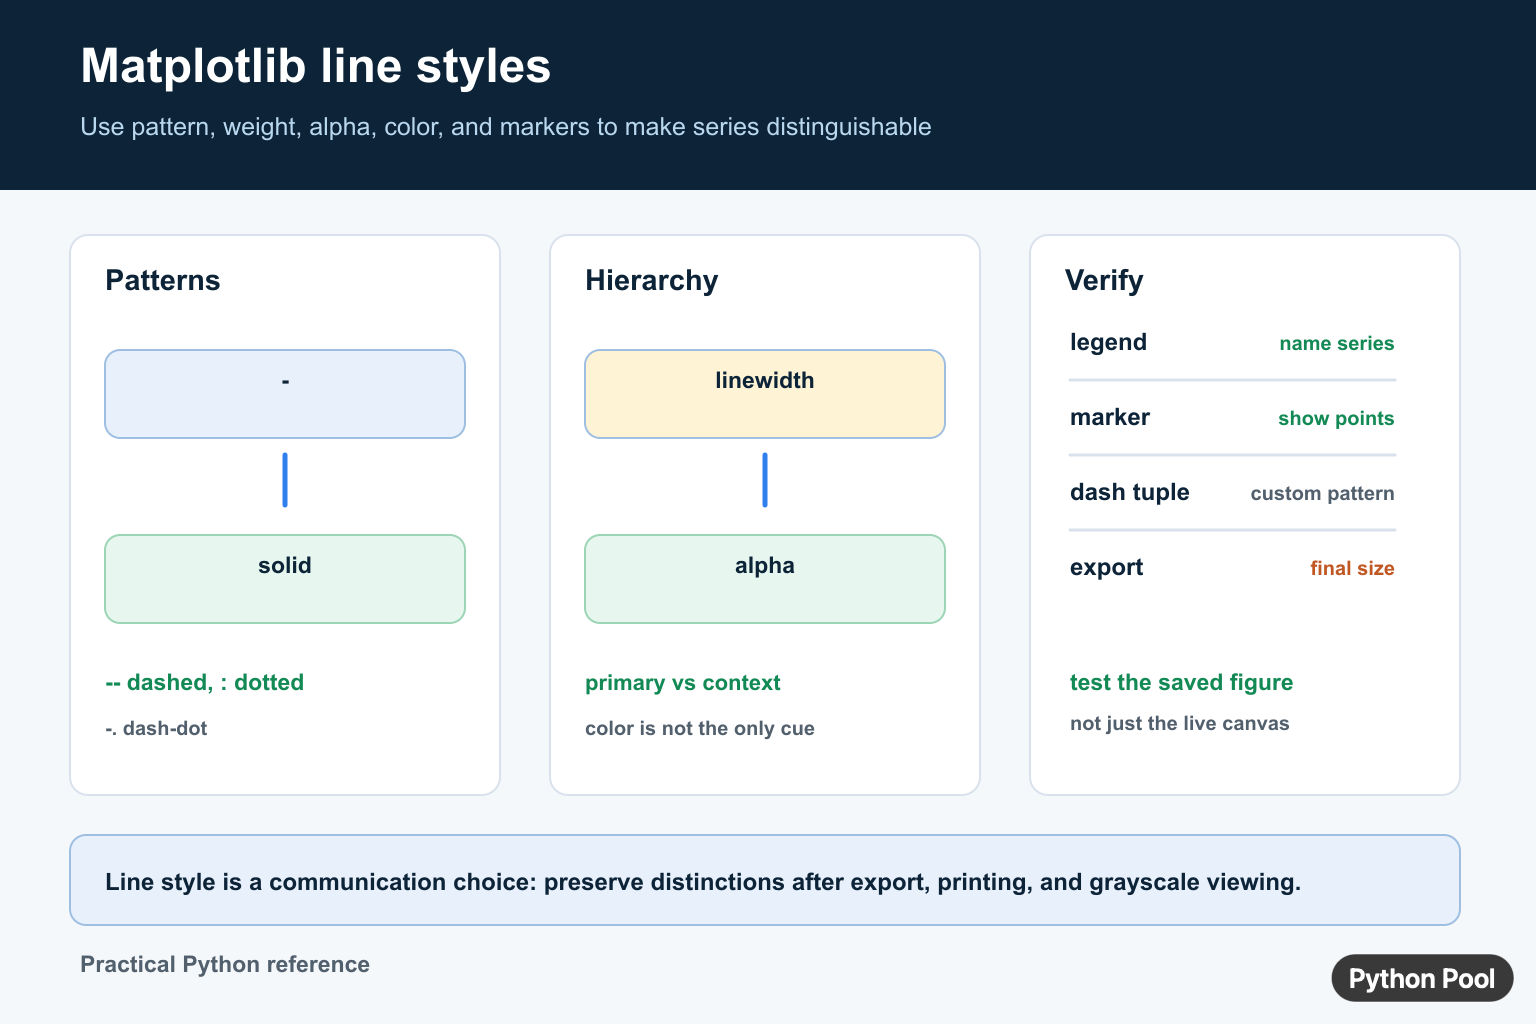
Matplotlib linestyles control how lines are drawn in Python plots. You can use short format strings such as "--", named styles such as "dashed", or custom dash patterns for more precise chart styling. Linestyles are often combined with markers, colors, linewidths, and labels so multiple series remain easy to compare.
The official matplotlib.pyplot.plot documentation explains that the optional format string can define color, marker, and linestyle at once. The Matplotlib linestyles gallery also shows named styles and custom dash tuples. For marker symbols, the Matplotlib marker reference is the authoritative list.
Good line styling is not only decoration. It helps readers distinguish measured values, forecasts, thresholds, and comparison series. A chart that relies only on color can fail in print, in screenshots, or for readers with limited color perception. Combining a restrained color palette with a small set of line patterns usually gives the most robust result.
Basic Matplotlib linestyles
The four common line styles are solid, dashed, dash-dot, and dotted. You can set them with either short strings or named strings. Short strings are compact, while named strings are easier to read in shared code.
import matplotlib.pyplot as plt

x = [1, 2, 3, 4]
y = [2, 4, 3, 5]

plt.plot(x, y, linestyle="solid", label="solid")
plt.plot(x, [value + 1 for value in y], linestyle="--", label="dashed")
plt.plot(x, [value + 2 for value in y], linestyle="-.", label="dash-dot")
plt.plot(x, [value + 3 for value in y], linestyle=":", label="dotted")
plt.legend()
plt.show()
Use the style that makes the chart readable in its final context. For black-and-white reports, different line patterns are often more useful than different colors. For dashboard charts, colors and markers can add another layer of distinction.
Use plot format strings
The plot() format string combines marker, line, and color in one positional argument. For example, "o--r" means circle markers, a dashed line, and red color. This is concise, but keyword arguments are clearer when a chart has many style choices.
import matplotlib.pyplot as plt

x = [1, 2, 3, 4]
y = [1, 4, 9, 16]

plt.plot(x, y, "o--r", label="format string")
plt.xlabel("x")
plt.ylabel("y")
plt.legend()
plt.show()
If a format string and keyword arguments conflict, Matplotlib gives precedence to the keyword arguments. For maintainable code, avoid mixing both styles unless the format string is very simple. Teams often prefer keyword arguments because reviewers can see each styling choice by name.
Combine linestyles with markers
Markers make individual data points visible, while linestyles show the connection between those points. This is useful for small datasets, measured observations, and charts where the exact data points matter.
import matplotlib.pyplot as plt

months = [1, 2, 3, 4, 5]
values = [12, 15, 14, 18, 21]

plt.plot(
    months,
    values,
    marker="o",
    linestyle="--",
    color="#2d7667",
    label="monthly value",
)
plt.legend()
plt.show()
Use marker size and color carefully. A large marker can hide nearby data, and a marker color that is too close to the background can disappear. For more chart types and visualization choices, see the broader Python data visualization guide.
Create custom dash patterns
For advanced styling, pass a dash tuple to linestyle. The first value is the dash offset. The second value is a sequence of on/off lengths in points. This gives you control beyond the built-in dashed and dotted styles.
import matplotlib.pyplot as plt

x = [0, 1, 2, 3, 4]
y = [0, 1, 4, 9, 16]

custom_dash = (0, (5, 2, 1, 2))
plt.plot(x, y, linestyle=custom_dash, linewidth=3, label="custom dash")
plt.legend()
plt.show()
Custom dashes are useful when multiple lines must remain distinct after printing, copying into slides, or viewing with limited color contrast. Keep the pattern simple enough that it still reads at small chart sizes. Very complex dash sequences can look noisy and distract from the data.
Style linewidth, alpha, and marker colors
Linestyle is only one Line2D property. You can also set linewidth, alpha, markerfacecolor, and markeredgecolor to make the line easier to scan.
import matplotlib.pyplot as plt

x = [1, 2, 3, 4]
y = [3, 5, 4, 7]

plt.plot(
    x,
    y,
    linestyle="-.",
    linewidth=2.5,
    marker="s",
    markerfacecolor="white",
    markeredgecolor="#4778b3",
    alpha=0.9,
)
plt.show()
Use heavier lines for the most important series and lighter styling for secondary series. If the plot includes grid lines, keep the data line visually stronger than the grid. The Matplotlib grid guide covers grid styling separately.
Use labels and legends clearly
When multiple linestyles appear in one figure, add labels and a legend. This lets the chart explain the visual encoding instead of forcing readers to guess which line pattern belongs to which series.
import matplotlib.pyplot as plt

x = [1, 2, 3, 4]
actual = [2, 4, 5, 7]
forecast = [3, 4, 6, 8]

plt.plot(x, actual, linestyle="solid", label="actual")
plt.plot(x, forecast, linestyle="dashed", label="forecast")
plt.title("Actual vs forecast")
plt.legend()
plt.show()
Linestyle choices should support the story of the chart. Use a dashed line for estimates, projections, or comparison series; use a solid line for observed or primary data. For adjacent Matplotlib topics, see Matplotlib boxplot, Matplotlib log scale, and Matplotlib ylim.
Common styling mistakes
Avoid using too many line patterns in a single figure. Four or five styles can already be hard to distinguish, especially when the chart is reduced in size. If the plot has many series, consider small multiples, direct labels, or a different chart type instead of adding more patterns.
Also avoid styling before the data story is clear. First decide which series is primary, which series is contextual, and what comparison the reader should make. Then use linestyle, marker, and color to reinforce that decision. This keeps the figure practical rather than decorative.
Use Named Or Shorthand Line Styles
Matplotlib accepts the common shorthand symbols -, --, :, and -., along with named styles such as solid, dashed, dotted, and dashdot. Choose styles that remain distinguishable when lines overlap or the figure is printed in grayscale.
import matplotlib.pyplot as plt

x = [0, 1, 2, 3]
fig, ax = plt.subplots()
ax.plot(x, [0, 1, 4, 9], linestyle="-", label="solid")
ax.plot(x, [0, 1, 2, 3], linestyle="--", label="dashed")
ax.plot(x, [3, 2, 1, 0], linestyle=":", label="dotted")
ax.legend()
fig.tight_layout()
Combine Style With Visual Hierarchy
Line style alone does not solve a crowded chart. Use linewidth and alpha to establish primary and supporting series, then add markers or a clear legend when the data needs point-level identification. Avoid using color as the only distinction when accessibility or printing matters.
Custom Dash Patterns
For a repeated custom pattern, set a dash sequence through the line object’s properties after plotting. Keep the pattern long enough to survive the final export size, and verify it in the saved PNG or PDF. A pattern that looks clear on a large interactive canvas can disappear after downscaling.
Frequently Asked Questions
How do I set a line style in Matplotlib?
Pass linestyle=’-‘, ‘–‘, ‘:’, or ‘-.’ to plot(), or use a named style such as solid, dashed, dotted, or dashdot.
How do I make Matplotlib lines easier to distinguish?
Combine linestyle with linewidth, color, alpha, markers, and a clear legend rather than relying on color alone.
Can Matplotlib use custom dash patterns?
Yes. Configure a dash sequence on the Line2D object when the built-in patterns do not match the figure’s visual system.
Why do my dash patterns disappear in the saved image?
A pattern that is visible on a large canvas can vanish after downscaling, so inspect the final PNG or PDF at its intended size.
