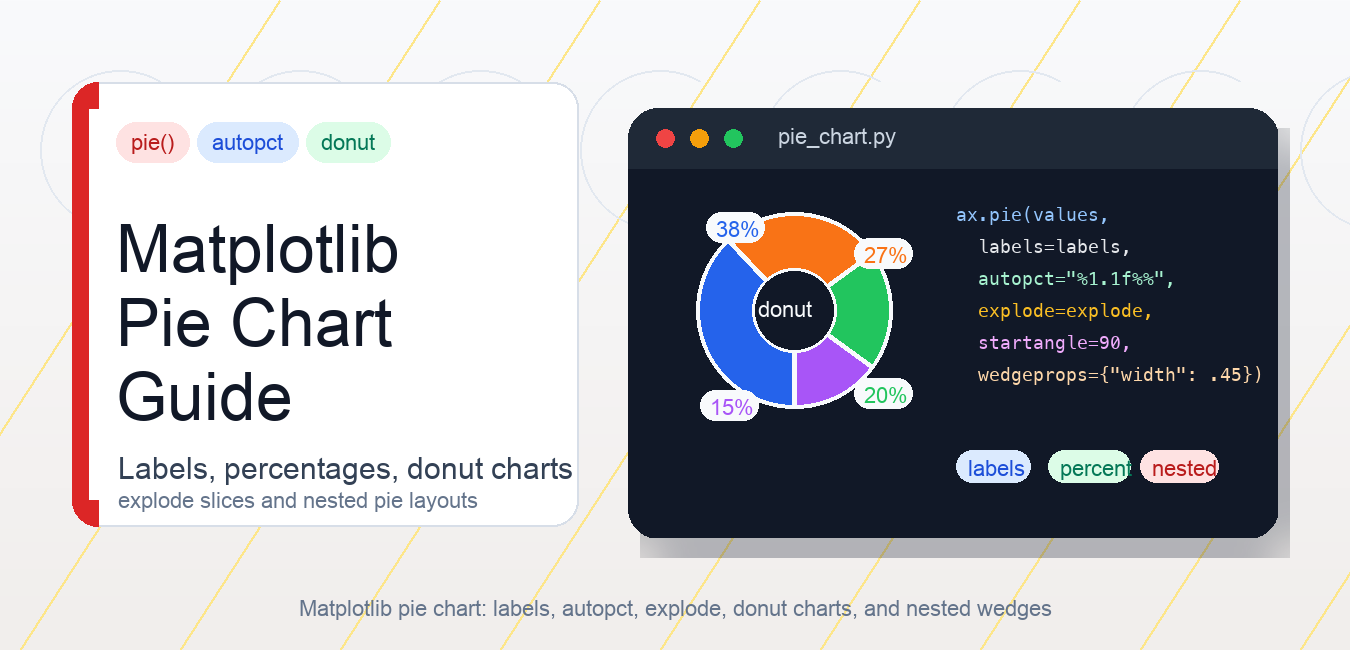
Quick answer: Use ax.pie() for a small set of categories that represent parts of one total. Add labels and percentages carefully, keep the Axes square so wedges remain circular, and use a donut configuration or a legend when labels would collide. A bar chart is usually better when the audience must compare many categories or small differences precisely.
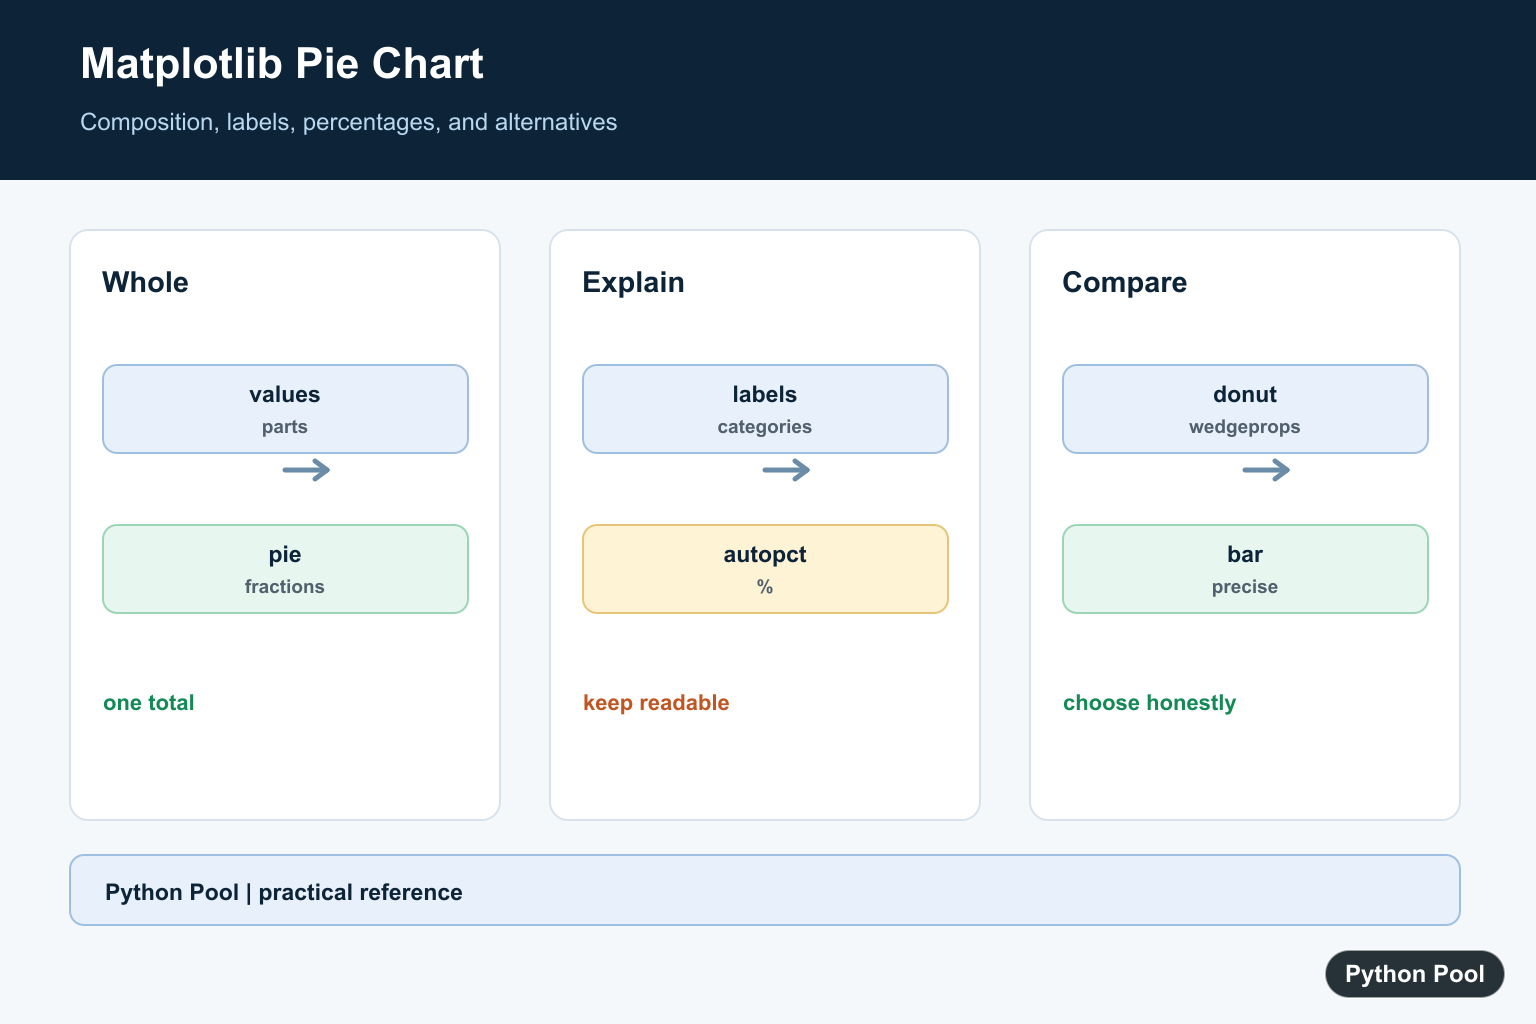
A Matplotlib pie chart shows how one total is divided into parts. In Python, the main function is matplotlib.pyplot.pie() or the axes method ax.pie(). Use it for a small number of categories where each slice is part of one whole.
Pie charts are easy to recognize, but they are not always the best chart type. If the audience needs to compare many categories or small differences, a bar chart is usually clearer. Use pie charts for simple composition, not for precise ranking.
Basic Matplotlib pie chart
The basic call needs numeric values. Labels are optional, but they make the chart much easier to understand.
import matplotlib.pyplot as plt

labels = ["Search", "Email", "Social", "Direct"]
values = [38, 27, 20, 15]

fig, ax = plt.subplots()
ax.pie(values, labels=labels)
ax.set_title("Traffic sources")
plt.show()
Matplotlib uses the values to calculate each slice as a fraction of the total. The values do not have to add up to 100. If they are counts, Matplotlib still calculates the proportions automatically.
Add percentages with autopct
The autopct argument prints percentages on the slices. A common format is "%1.1f%%", which shows one decimal place.
fig, ax = plt.subplots()
ax.pie(
    values,
    labels=labels,
    autopct="%1.1f%%",
    startangle=90,
)
ax.set_title("Traffic sources")
plt.show()
startangle=90 rotates the first slice so the chart often reads more naturally from the top. If labels overlap, move labels outside the chart, use a legend, or choose a bar chart instead.
Explode a slice
Use explode to offset one or more slices from the center. This can highlight a category, but use it sparingly because it adds visual emphasis.
explode = [0, 0.08, 0, 0]

fig, ax = plt.subplots()
ax.pie(
    values,
    labels=labels,
    explode=explode,
    shadow=True,
    autopct="%1.1f%%",
)
plt.show()
The explode list must match the number of slices. A value of 0 keeps a slice in place. A positive value moves it outward. If every slice is exploded, the chart usually becomes harder to read.
Create a donut chart
A donut chart is a pie chart with a hole in the center. In Matplotlib, set the wedge width with wedgeprops.
fig, ax = plt.subplots()
ax.pie(
    values,
    labels=labels,
    autopct="%1.1f%%",
    startangle=90,
    wedgeprops={"width": 0.45},
)
ax.text(0, 0, "Total", ha="center", va="center")
plt.show()
Donut charts can leave room for a short center label. Keep that label brief. If the center text becomes a paragraph, the chart is doing too much.
Nested pie chart
A nested pie chart uses two rings. The outer ring can show major groups, while the inner ring shows subgroups. This layout is useful only when the relationship is simple enough to read at a glance.
outer = [40, 35, 25]
inner = [20, 20, 15, 20, 10, 15]

fig, ax = plt.subplots()
ax.pie(outer, radius=1.0, wedgeprops={"width": 0.3})
ax.pie(inner, radius=0.7, wedgeprops={"width": 0.3})
ax.set(aspect="equal")
plt.show()
For complex nested categories, a stacked bar chart is usually easier to compare. If the data needs a custom subplot layout next to other plots, see Matplotlib GridSpec.
Use legends for long labels
Long category names can make a pie chart messy. In that case, use short wedges and move the full labels into a legend.
fig, ax = plt.subplots()
wedges, texts, autotexts = ax.pie(values, autopct="%1.1f%%")
ax.legend(wedges, labels, title="Sources", loc="center left", bbox_to_anchor=(1, 0.5))
plt.show()
If the legend gets clipped when saving, use bbox_inches="tight". The refreshed Matplotlib savefig() guide covers export settings for charts with legends and labels.
Colors and styling
You can pass a list of colors directly, or use a Matplotlib colormap to generate consistent colors. For ordered numeric data, use colormaps carefully; for categories, qualitative colors are usually better.
colors = ["#2563eb", "#f97316", "#22c55e", "#a855f7"]
ax.pie(values, labels=labels, colors=colors, autopct="%1.1f%%")
For more about choosing color palettes, read Matplotlib cmap. For annotations outside pie charts, see Matplotlib annotate(). Interactive updates are a separate topic; Matplotlib ion() covers interactive mode.
When to avoid pie charts
Avoid pie charts when there are many slices, when values are close together, or when categories are not parts of one total. A horizontal bar chart is often clearer because readers can compare lengths more accurately than angles.
If you need to compare categories side by side, use a bar chart. PythonPool has related Matplotlib guides for horizontal bar charts and 2D histograms. Pie charts work best when there are roughly two to six categories and the takeaway is simple.
Practical cleanup checklist
Before publishing a pie chart, check that the values describe parts of the same total, the labels are short, and the percentage text does not overlap. Keep the chart circular with an equal aspect ratio when needed. Use a legend for long category names. Export the final figure at a useful size and resolution so labels remain readable in the destination page, slide, or report.
If the chart has too many slices, group small categories into “Other” or switch to a bar chart. If the chart needs multiple rings, make sure each ring has a clear relationship to the others. A nested pie that needs a long explanation is usually a signal that a table or grouped bar chart would communicate better.
Official Matplotlib references
- pyplot.pie documentation
- Axes.pie documentation
- Matplotlib pie features gallery
- Nested pie chart gallery
- pyplot.subplots documentation
- Axes.legend documentation
- pyplot.savefig documentation
- Axes.set_title documentation
Create A Labeled Composition Chart
The input values do not have to sum to 100; Matplotlib normalizes them into fractions of their total. A label sequence should have one entry per value, and a title should explain what the whole represents.
import matplotlib.pyplot as plt

labels = ["Search", "Email", "Social", "Direct"]
values = [38, 27, 20, 15]
fig, ax = plt.subplots(figsize=(5, 5))
ax.pie(values, labels=labels, startangle=90)
ax.set_title("Traffic sources")
ax.set_aspect("equal")
Show Percentages Without Clutter
autopct adds percentage labels, but small slices can become crowded. Use a consistent format, consider moving category names to a legend, and keep the number of categories small enough to read on the target screen.
import matplotlib.pyplot as plt

values = [45, 30, 15, 10]
labels = ["Core", "Growth", "Support", "Other"]
fig, ax = plt.subplots(figsize=(5, 5))
wedges, texts, percentages = ax.pie(
    values,
    labels=None,
    autopct="%1.1f%%",
    startangle=90,
)
ax.legend(wedges, labels, loc="center left", bbox_to_anchor=(1, 0.5))
ax.set_aspect("equal")
Build A Donut Chart Carefully
A donut chart is still a composition chart; the hole does not add a second variable. Use wedgeprops with a width and keep the center empty or use it for one clear total label.
import matplotlib.pyplot as plt

values = [60, 25, 15]
labels = ["Complete", "Active", "Blocked"]
fig, ax = plt.subplots(figsize=(5, 5))
ax.pie(
    values,
    labels=labels,
    wedgeprops={"width": 0.4, "edgecolor": "white"},
    startangle=90,
)
ax.text(0, 0, "100%", ha="center", va="center")
ax.set_aspect("equal")
Choose A Bar Chart For Precise Comparison
Pie angles and areas are harder to compare than aligned bar lengths. If the question is ranking, change over time, or a difference between close values, a bar chart with a common baseline is usually the more honest visual.
import matplotlib.pyplot as plt

labels = ["A", "B", "C", "D"]
values = [38, 35, 33, 31]
fig, ax = plt.subplots()
ax.bar(labels, values, color="tab:blue")
ax.set_ylabel("value")
ax.set_title("Compare categories precisely")
Matplotlib documents Axes.pie(), including labels, autopct, explode, normalize, and wedge properties. Related references include bar charts, horizontal bars, and aspect ratio.
For related chart choices, compare bar charts, horizontal bars, and aspect ratio before using a pie chart for precise comparisons.
Frequently Asked Questions
How do I create a pie chart in Matplotlib?
Pass a one-dimensional sequence of values to ax.pie(), add labels, and use ax.set_aspect(‘equal’) so the chart remains circular.
How do I show percentages on a pie chart?
Pass a format string or callable to autopct, such as ‘%1.1f%%’, and check that labels remain readable.
How do I make a donut chart?
Use wedgeprops with a nonzero width, for example wedgeprops={‘width’: 0.4}, to leave a hole in the center.
When is a bar chart better than a pie chart?
Use a bar chart when there are many categories, small differences, or a need for accurate ranking and comparison.

Hello,
I have tried to use your codes, but I have some problems. Could you help me?
Preeya
Yes, sure. May I know what problems you are facing?