
Quick answer: Use ax.set_xscale(‘log’) or ax.set_yscale(‘log’) for positive data spanning orders of magnitude. Choose symlog or another scale when zero or negative values are meaningful, and set locators, formatters, and limits deliberately.
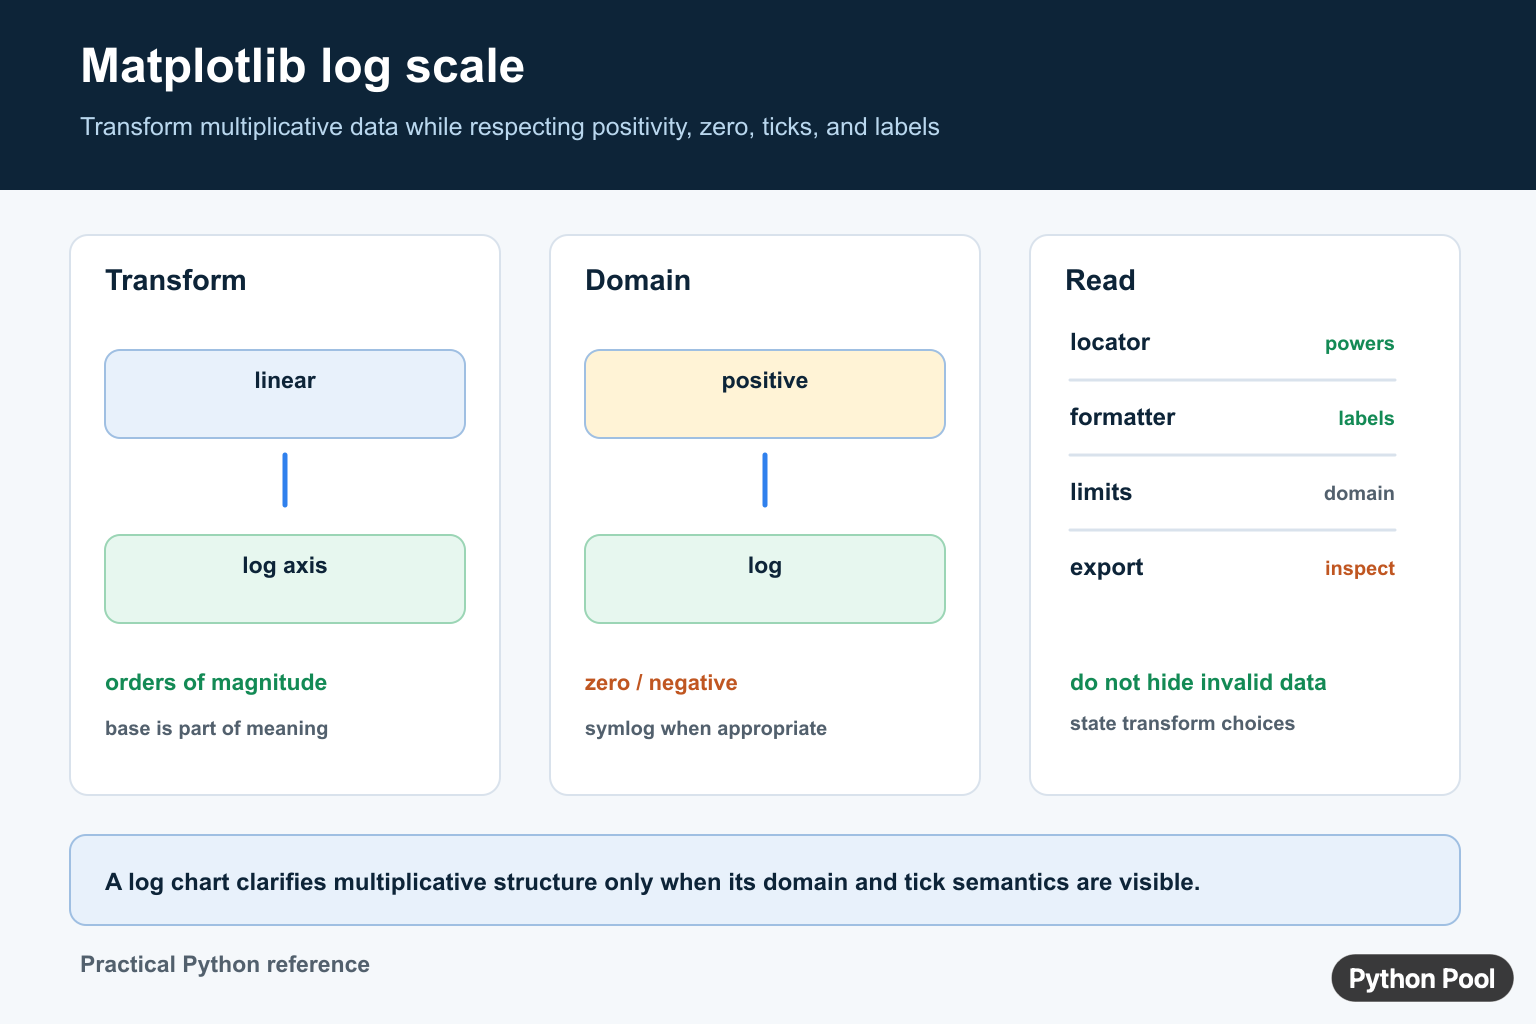
A Matplotlib log scale displays axis values by powers instead of equal linear steps. This is useful when data spans several orders of magnitude, such as growth curves, frequencies, execution times, file sizes, population counts, model loss values, or scientific measurements.
The official Matplotlib documentation for log scale examples shows how logarithmic axes change tick spacing. The API references for set_xscale(), set_yscale(), and loglog() cover the main calls.
Use a log axis when ratios matter more than absolute differences. On a linear y-axis, the change from 10 to 20 looks the same size as the change from 1000 to 1010. On a log y-axis, multiplicative growth is easier to compare because equal visual gaps represent equal ratios.
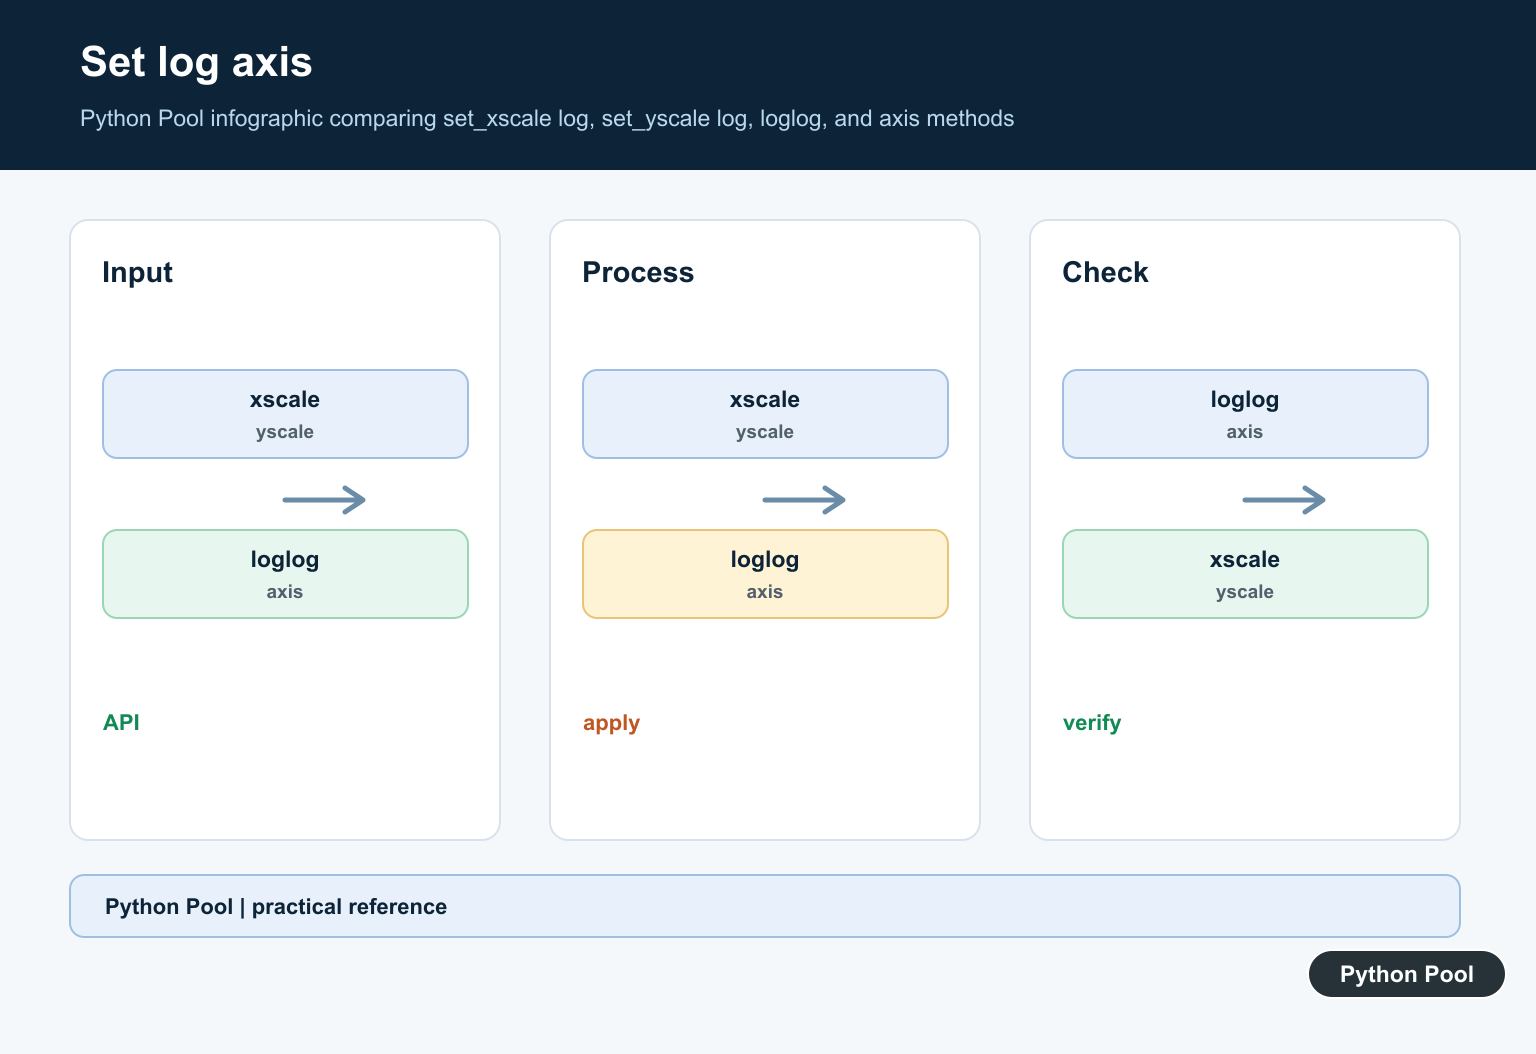
The most important rule is that ordinary logarithmic axes need positive values. Zero and negative values cannot be shown on a standard log scale. Filter, transform, or choose a different scale before plotting those values.
Matplotlib gives you several entry points. semilogx() applies a log scale to the x-axis. semilogy() applies it to the y-axis. loglog() applies it to both axes. You can also create a normal plot and then call set_xscale("log") or set_yscale("log").
A log chart should not be used to hide important differences. It is best when it makes a wide range readable while the caption, axis labels, and surrounding text make the transformed scale obvious to the reader.
Plot A Log Y-Axis
Use semilogy() when the y-values cover a wide range and the x-values are ordinary positions, steps, or labels.
try:
    import matplotlib.pyplot as plt
except ModuleNotFoundError:
    print("Install matplotlib to run this example.")
else:
    days = [1, 2, 3, 4, 5]
    counts = [10, 100, 1000, 10000, 100000]

    plt.semilogy(days, counts, marker="o")
    plt.xlabel("day")
    plt.ylabel("count")
    plt.title("Log-scaled counts")
    plt.close()
The y-axis tick positions show powers rather than evenly spaced linear values. This makes exponential growth readable without the smaller values flattening against the bottom of the chart.
For reports, label the axis clearly so readers know they are seeing a logarithmic view, not a normal linear scale.
Set Axis Scale Manually
You can create a normal figure and then set the scale on an axis object. This style works well in larger plotting functions.
try:
    import matplotlib.pyplot as plt
except ModuleNotFoundError:
    print("Install matplotlib to run this example.")
else:
    sizes = [1, 10, 100, 1000]
    times = [0.02, 0.12, 1.4, 18.0]

    fig, ax = plt.subplots()
    ax.plot(sizes, times, marker="s")
    ax.set_xscale("log")
    ax.set_yscale("log")
    ax.set_xlabel("input size")
    ax.set_ylabel("seconds")
    plt.close(fig)
This is the most explicit form because the axis object owns the scale setting. It is also easier to combine with custom ticks, labels, grid lines, and multiple subplots.
If a chart has several axes, set the scale on each axis intentionally rather than relying on a global pyplot call.
Use loglog For Both Axes
loglog() is a shortcut for a plot where both axes use logarithmic scaling.
try:
    import matplotlib.pyplot as plt
except ModuleNotFoundError:
    print("Install matplotlib to run this example.")
else:
    x_values = [1, 10, 100, 1000]
    y_values = [2, 20, 200, 2000]

    plt.loglog(x_values, y_values, marker="o")
    plt.xlabel("x")
    plt.ylabel("y")
    plt.title("Both axes are logarithmic")
    plt.close()
This is useful for power laws, algorithm scaling, and measurements where both dimensions span wide ranges.
A straight-looking line on a log-log chart often means a multiplicative relationship. It should still be interpreted carefully because the scale changes visual perception.
Change The Log Base
The default base is 10, but you can choose another base. Base 2 is common for memory sizes, tree depths, and binary growth.
try:
    import matplotlib.pyplot as plt
except ModuleNotFoundError:
    print("Install matplotlib to run this example.")
else:
    sizes = [1, 2, 4, 8, 16, 32]
    memory = [64, 128, 256, 512, 1024, 2048]

    fig, ax = plt.subplots()
    ax.plot(sizes, memory, marker="o")
    ax.set_xscale("log", base=2)
    ax.set_yscale("log", base=2)
    ax.set_xlabel("workers")
    ax.set_ylabel("memory MB")
    plt.close(fig)
The base affects tick placement and labels. Choose the base that matches the story in the data rather than using base 10 by habit.
If the audience expects powers of two, a base-2 axis can make the chart easier to scan.
Use Log Scale With Histograms
Histograms often have a few very tall bins and many small bins. A log-scaled count axis can make the smaller bars visible.
try:
    import matplotlib.pyplot as plt
except ModuleNotFoundError:
    print("Install matplotlib to run this example.")
else:
    values = [1, 1, 1, 2, 2, 3, 10, 30, 100, 300]

    fig, ax = plt.subplots()
    ax.hist(values, bins=5)
    ax.set_yscale("log")
    ax.set_xlabel("value")
    ax.set_ylabel("frequency")
    plt.close(fig)
This does not change the data; it changes how bin counts are displayed. Always mention the log scale when presenting the chart.
For distributions with zero-count bins, check how the chart renders and whether a different binning strategy communicates the data more honestly.
Filter Nonpositive Values
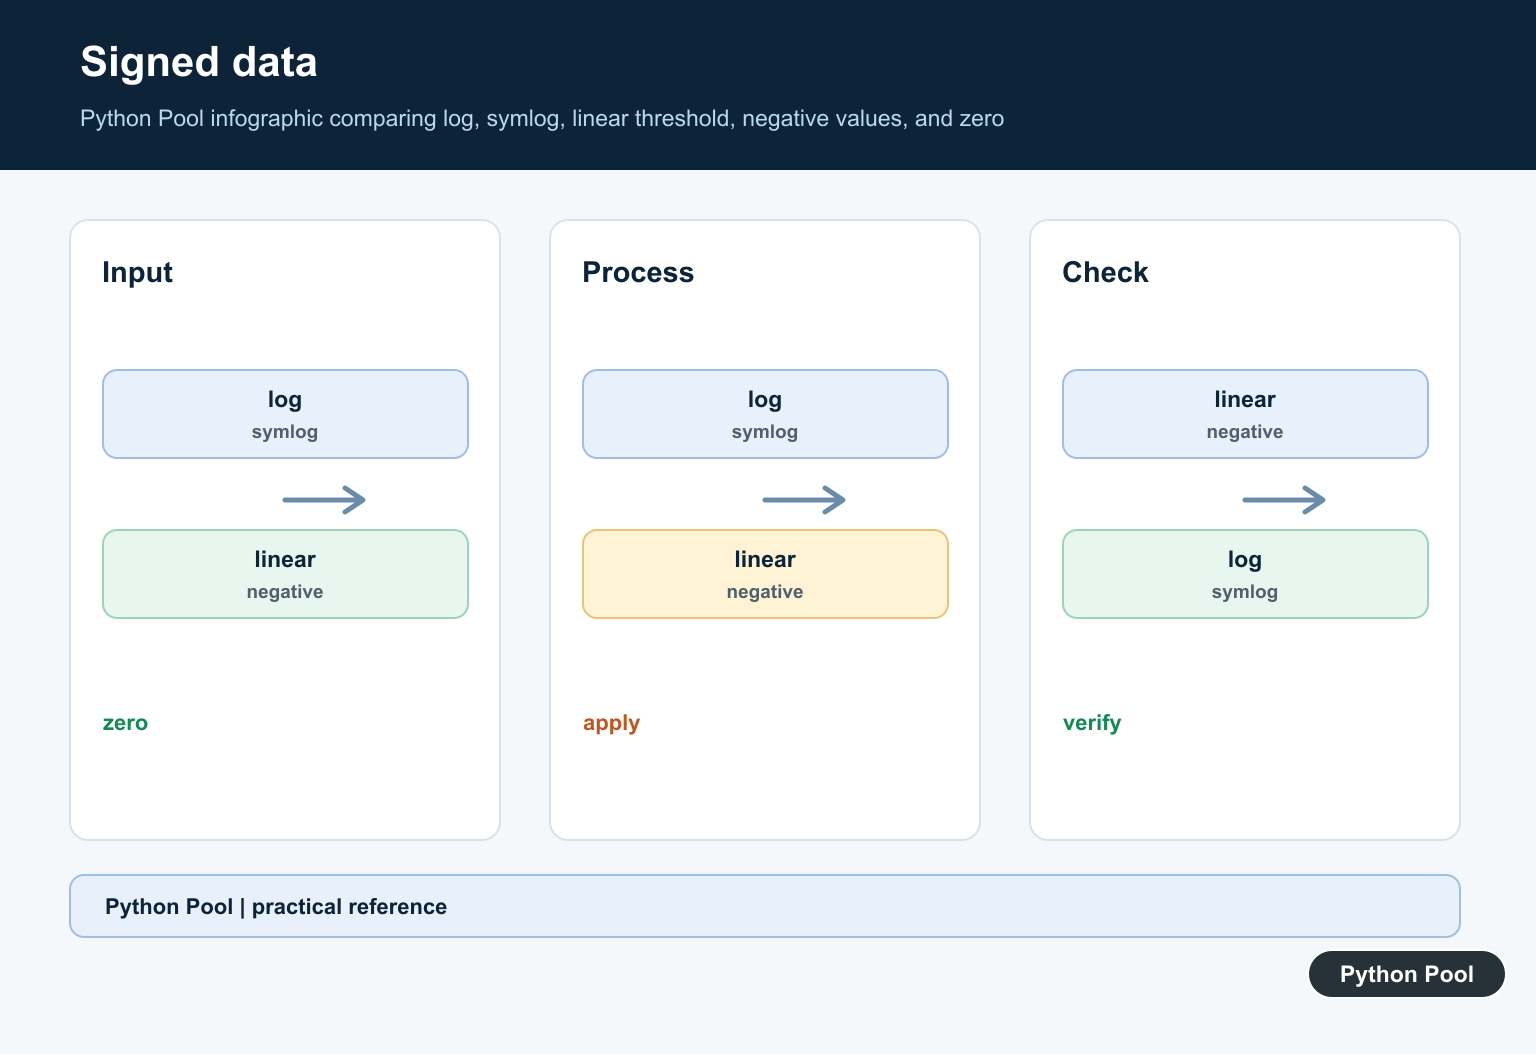
Before using a standard log axis, remove or transform zero and negative values. The right choice depends on the meaning of the data.
try:
    import matplotlib.pyplot as plt
except ModuleNotFoundError:
    print("Install matplotlib to run this example.")
else:
    pairs = [(1, 10), (2, 0), (3, 30), (4, -5), (5, 100)]
    positive_pairs = [(x, y) for x, y in pairs if y > 0]
    x_values = [x for x, y in positive_pairs]
    y_values = [y for x, y in positive_pairs]

    plt.semilogy(x_values, y_values, marker="o")
    plt.title("Only positive values on a log axis")
    plt.close()
Filtering is clear when nonpositive values are invalid for the analysis. If zero has a real meaning, consider a different visualization, a symmetric log scale, or a carefully documented transformation.
In short, use semilogx() for log x-values, semilogy() for log y-values, loglog() for both axes, and axis methods when building reusable plotting code. Check positivity first, label the scale clearly, and choose a base that matches the data.
Apply A Log Scale To An Axis
A logarithmic axis changes the coordinate transform so multiplicative differences become easier to compare. It requires positive values for the ordinary log scale. Set the scale on the Axes object so the intent is tied to the specific plot.
import matplotlib.pyplot as plt

sizes = [1, 10, 100, 1000]
times = [3, 5, 12, 30]

fig, ax = plt.subplots()
ax.plot(sizes, times, marker="o")
ax.set_xscale("log", base=10)
ax.set_xlabel("Input size")
ax.set_ylabel("Time")
fig.tight_layout()
Choose The Scale From The Data Domain
Ordinary log scales cannot represent zero or negative values. symlog provides a linear region around zero with logarithmic behavior outside it; its threshold must match the data’s meaningful range. Do not replace zeros with a tiny positive number without documenting how that changes the analysis.
Make Ticks And Labels Readable
Log ticks represent powers and multiples, not equal linear distances. Use appropriate locators and formatters, label the units, and inspect the saved figure at its final size. A log transform can clarify a trend while still misleading readers if the base, limits, or invalid-value policy is hidden.
For readable log axes, compare Matplotlib tick positioning with current Axes control. Read matplotlib xticks and matplotlib gca for the related workflow.
Frequently Asked Questions
How do I set a logarithmic axis in Matplotlib?
Call ax.set_xscale(‘log’) or ax.set_yscale(‘log’), optionally specifying the base, on the Axes you want to transform.
Can a Matplotlib log scale show zero or negative values?
An ordinary log scale requires positive values; choose symlog or another domain-appropriate transform when zero or negative values matter.
Why do log-axis ticks look different?
Log ticks represent powers and multiples rather than equal linear intervals, so use suitable locators, formatters, and labels.
Should I replace zero with a tiny value for a log plot?
Only with a documented analytical reason; replacing zero changes the data and can create a misleading visual conclusion.

Thank you very much, buddy!
I’m glad you liked it!
Regards,
Pratik
using log scale doesn’t work for 3d plots
No, you can do it for 3d plots too. Just set the scale for all 3 axes –
ax.xaxis.set_scale(‘log’)
ax.yaxis.set_scale(‘log’)
ax.zaxis.set_scale(‘log’)