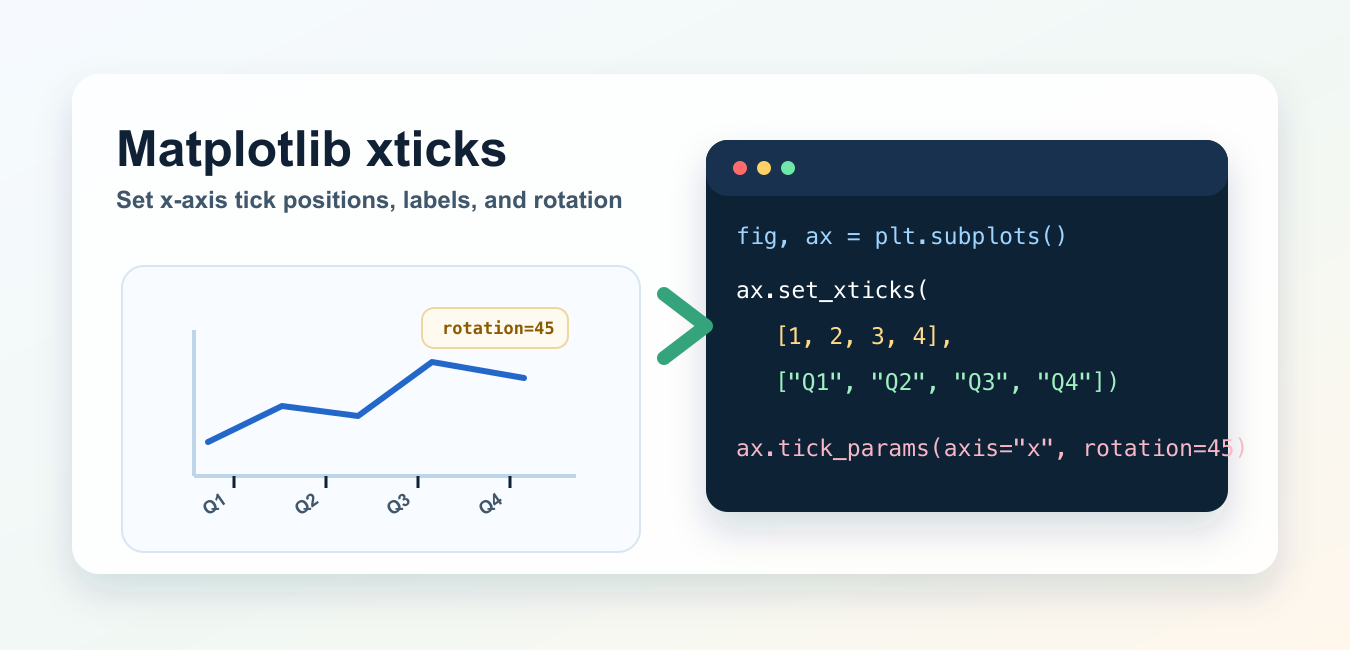
Matplotlib x-axis ticks are the positions and labels shown along the horizontal axis. For current code, the clearest approach is usually to work through an Axes object with ax.set_xticks(). The pyplot helper plt.xticks() remains convenient for a quick one-axes script.
Quick Answer
Use ax.set_xticks(positions, labels) when you need fixed locations and custom text, ax.tick_params() for rotation and appearance, and a locator when tick frequency should follow an interval rather than a hard-coded list.
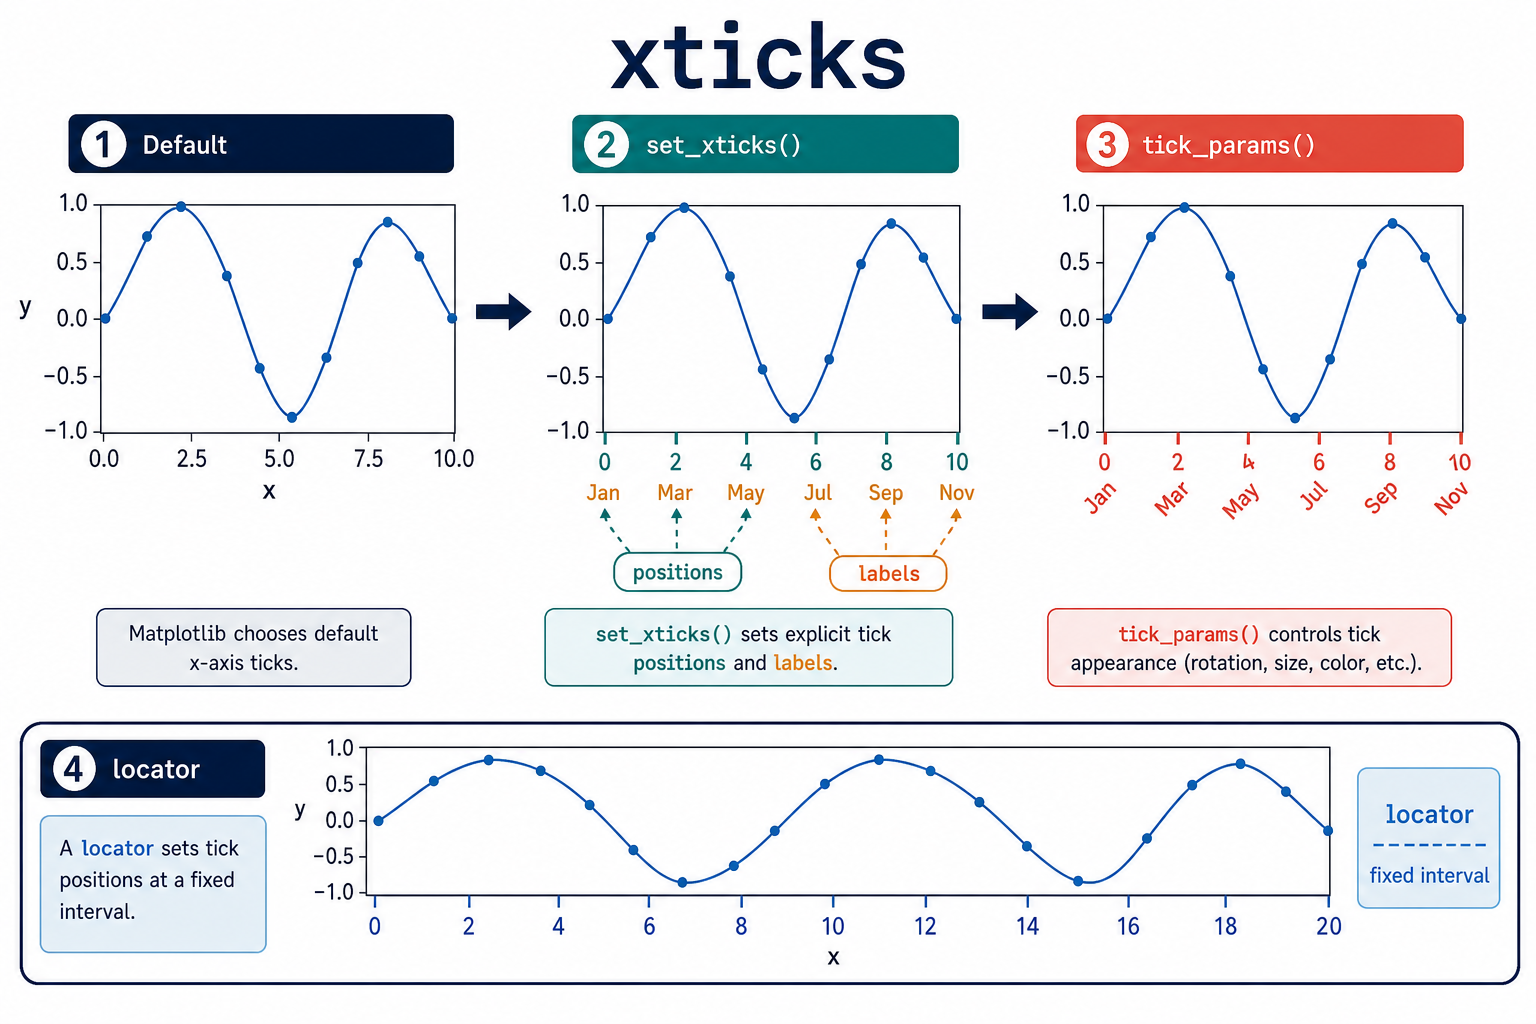
The official Axes.set_xticks reference explains that explicit ticks replace the axis locator and may expand the view limits so all ticks are visible. The pyplot.xticks reference covers the stateful helper.
Set Explicit Tick Positions
Pass a sequence of numeric positions to set_xticks(). The default formatter creates labels for those positions.
import matplotlib.pyplot as plt

fig, ax = plt.subplots()
ax.plot([0, 1, 2, 3], [4, 2, 5, 3])
ax.set_xticks([0, 1, 2, 3])
ax.set_xlabel('sample')
plt.show()
Use this form when the numeric positions are correct but the default formatting needs no change. Remember that setting explicit ticks replaces the axis’s locator for that axis.
Set Positions And Labels Together
Provide labels with the same length as the positions when the text should differ from the numeric values.
import matplotlib.pyplot as plt

fig, ax = plt.subplots()
ax.plot([0, 2, 4, 6], [1, 3, 2, 5])
ax.set_xticks(
    [0, 2, 4, 6],
    ['Jan', 'Mar', 'May', 'Jul'],
)
plt.show()
Keep the mapping between position and label explicit. Passing a different number of labels than tick positions is a data-shape error, not a styling issue.
Use tick_params For Appearance
Use tick_params() for rotation, size, direction, color, and padding. Do not use set_xticklabels() as a general styling shortcut when a formatter or locator is more appropriate.
import matplotlib.pyplot as plt

fig, ax = plt.subplots()
ax.plot([0, 1, 2], [3, 1, 4])
ax.set_xticks([0, 1, 2], ['Short', 'Medium', 'Long'])
ax.tick_params(axis='x', labelrotation=30, pad=6)
plt.tight_layout()
plt.show()
Check the saved figure after rotating labels. A label that fits in an interactive window can still be clipped in a small exported image.
Use A Locator For Regular Intervals
When ticks should appear at a regular interval across changing data, use a locator rather than manually calculating a fixed list.
import matplotlib.pyplot as plt
from matplotlib.ticker import MultipleLocator

fig, ax = plt.subplots()
ax.plot(range(21), [value * value for value in range(21)])
ax.xaxis.set_major_locator(MultipleLocator(5))
ax.set_xlabel('value')
plt.show()
A locator adapts to the axis range. This is more robust for zooming, refreshed data, and reusable chart code than hard-coded tick positions.
Use Date Locators For Dates
For dates, let Matplotlib’s date units and date locators handle calendar spacing. Do not treat date strings as arbitrary category text when the axis represents elapsed time.
import matplotlib.pyplot as plt
import matplotlib.dates as mdates
from datetime import datetime, timedelta

start = datetime(2026, 1, 1)
dates = [start + timedelta(days=day) for day in range(0, 31, 5)]
values = [3, 5, 4, 7, 6, 8, 9]

fig, ax = plt.subplots()
ax.plot(dates, values)
ax.xaxis.set_major_locator(mdates.DayLocator(interval=5))
fig.autofmt_xdate()
plt.show()
Choose a locator interval that matches the display width. Too many date labels create overlap and make the axis harder to read.
Remove Or Add Minor Ticks
Pass minor=True to set_xticks() when you are explicitly controlling minor tick positions. Style major and minor ticks separately with tick_params(which='major') and tick_params(which='minor').
Do not add minor ticks purely for decoration. They should help readers estimate values and should remain visible at the output size.
Common xticks Problems
- Labels and positions have different lengths.
- Hard-coded ticks remain after the data range changes.
- Rotated labels overlap because the figure has no bottom margin.
- A locator is replaced by set_xticks when fixed positions were not intended.
- Date strings are treated as categories when elapsed time matters.
The practical rule is to use explicit ticks for a deliberate small set, a locator for a changing regular interval, and the Axes API for maintainable multi-panel figures.
Do Not Couple Labels To A Changing Locator
Fixed labels belong to fixed positions. If an interactive plot changes its x limits or locator, a hard-coded label list can become misleading. Use a formatter or locator-aware labels when the axis is dynamic.
When a label is longer than the available space, prefer a readable rotation and a larger bottom margin over a tiny font. The chart should remain legible in the exported image and in a small embedded view.
Set Limits After Explicit Ticks When Needed
Matplotlib may expand the view limits so explicit ticks remain visible. If the chart contract requires exact limits, call ax.set_xlim() after setting the ticks and then confirm that no intended tick has been hidden.
Check both ends of the axis. A clipped first or last label is easy to miss when a chart is inspected only in a notebook and is a common cause of unreadable screenshots.
Test Tick Formatting
Test a small and a large data range, a negative range when relevant, and the final saved image. Confirm that labels match the underlying units and that no duplicate or misleading labels appear.
For dates and currencies, use a formatter that communicates the unit. Tick positions alone do not tell a reader whether a number is a date ordinal, a dollar amount, or a count.
plt.xticks() For A Quick One-Axes Script
The pyplot helper can be convenient when the current axes is unambiguous:
import matplotlib.pyplot as plt

plt.plot([0, 1, 2], [2, 3, 1])
plt.xticks([0, 1, 2], ['start', 'middle', 'end'])
plt.show()
For reusable functions or multiple panels, keep the Axes handle instead. Explicit state makes it clear which subplot receives the ticks and avoids modifying a plot that happened to be current.
Multiple Axes Need Scoped Tick Updates
Call set_xticks() on each intended axes rather than relying on global pyplot state. This is especially important when one panel uses dates, another uses numeric units, and a third uses categorical labels.
After all tick changes, inspect the full figure at its target size. Tick labels are part of the data presentation and should not be treated as expendable decoration.
For complete axis layout, compare Matplotlib current Axes with subplot spacing controls. Read matplotlib gca and matplotlib subplot spacing for the related workflow.
Frequently Asked Questions
How do I set x-axis ticks in Matplotlib?
Use ax.set_xticks() with a sequence of positions, optionally followed by a same-length sequence of labels. Use the Axes API for maintainable multi-panel figures.
How do I rotate Matplotlib x tick labels?
Call ax.tick_params(axis=’x’, labelrotation=30) or use a figure-level date formatting helper when the labels represent dates.
What is a Matplotlib locator?
A locator chooses tick positions according to a rule such as a fixed interval. It is more adaptable than a hard-coded list when the axis range changes.
Why do my x tick labels overlap?
Reduce the label count, rotate or wrap labels, increase figure width, and apply a layout tool such as tight_layout after setting the ticks.
