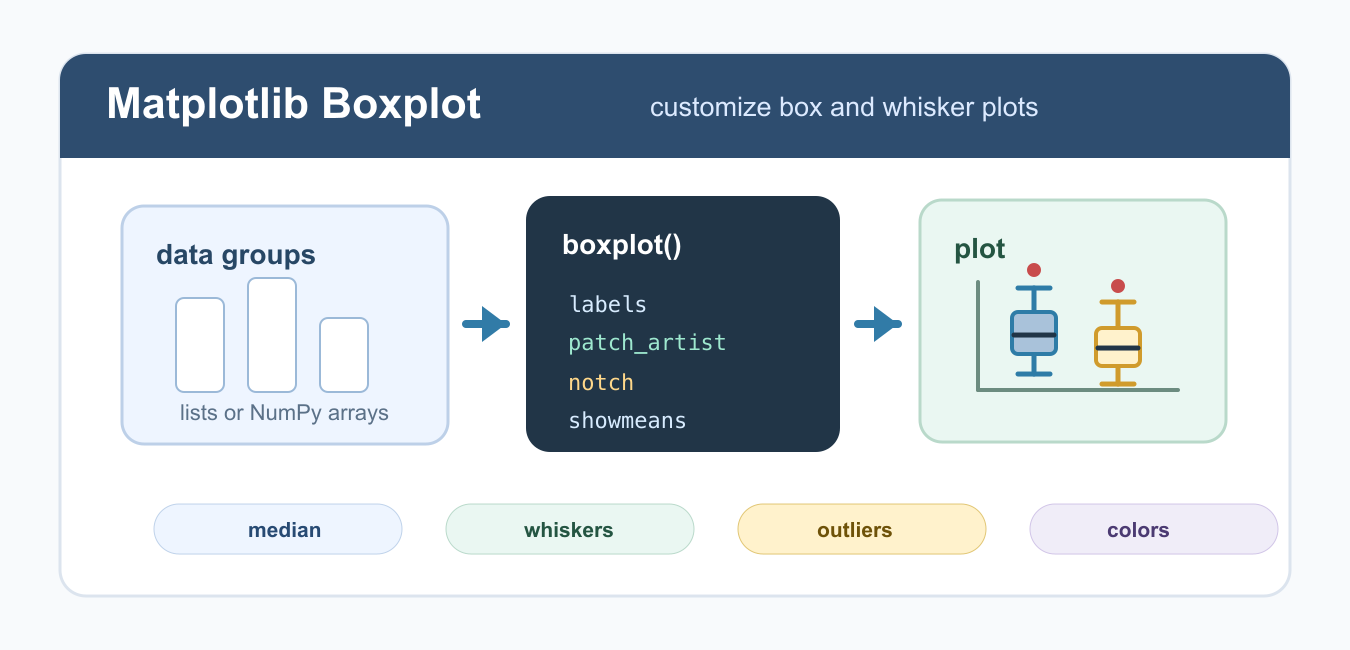
Quick answer: A boxplot communicates quartiles, median, whiskers, and outliers. Start with plt.boxplot(data), then add labels, patch colors, a mean marker, notches, and a deliberate whisker rule so the visual matches the statistical question.
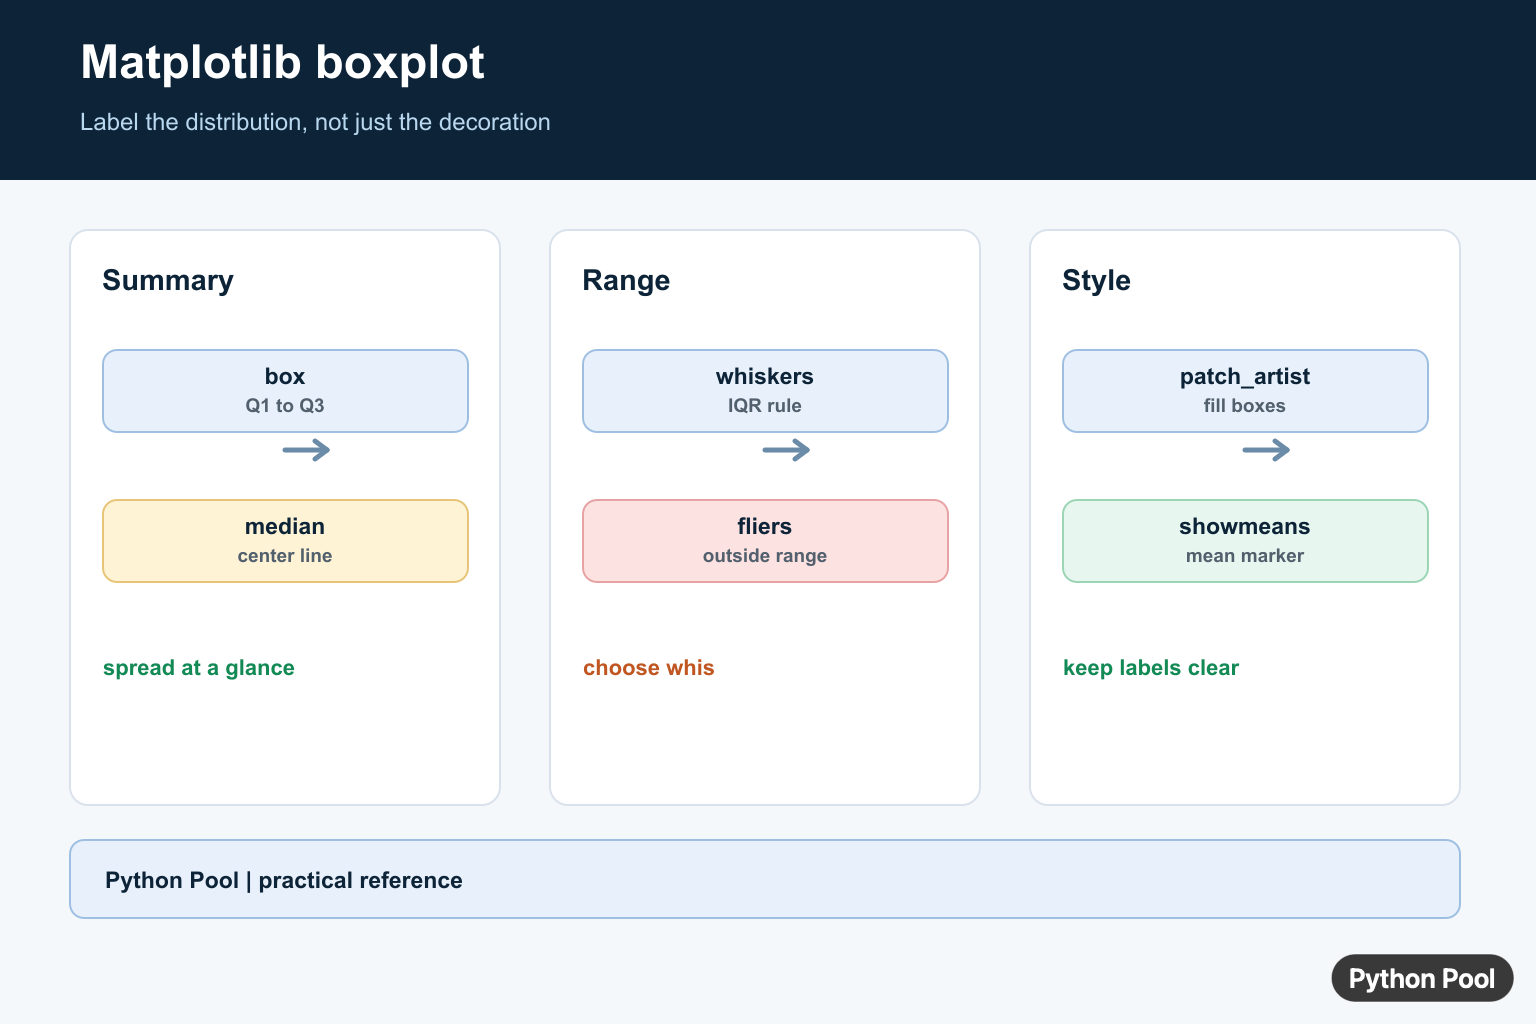
A Matplotlib boxplot summarizes a numeric distribution with quartiles, a median line, whiskers, and optional outlier points. It is useful when you need to compare spread, skew, and unusual values across one or more groups without plotting every data point.
In Matplotlib, boxplots are created with Axes.boxplot() or pyplot.boxplot(). The box spans the first to third quartile, the line inside the box marks the median, and the default whiskers extend to the farthest points within 1.5 times the interquartile range. Points beyond that rule are plotted as fliers.
Read a boxplot from the center outward. The median shows the middle value, the box height shows the central spread, whisker length shows how far typical values extend, and fliers call attention to values outside the whisker rule. When two groups have similar medians but very different box heights, their central tendency may match while their variability differs. That is the main reason boxplots are useful for comparison.
Create a Basic Matplotlib Boxplot
For new code, create a figure and axes first, then call ax.boxplot(). This style is easier to customize than relying only on plt.boxplot(), especially when the chart needs labels, colors, or multiple subplots.
import matplotlib.pyplot as plt

scores = [72, 75, 78, 80, 83, 85, 88, 91, 95, 109]

fig, ax = plt.subplots()
ax.boxplot(scores)
ax.set_title("Exam score distribution")
ax.set_ylabel("Score")
plt.show()
The outlier at the high end remains visible, while the median and middle 50% of the data are compact. For figure sizing before export, see the guide to Matplotlib figsize.
Plot Multiple Boxplots
Pass a list of arrays or lists to compare several groups. Use tick_labels for category names so each box is readable on the x-axis.
import matplotlib.pyplot as plt
import numpy as np

rng = np.random.default_rng(42)
data = [
    rng.normal(70, 8, 80),
    rng.normal(76, 6, 80),
    rng.normal(82, 10, 80),
]

fig, ax = plt.subplots()
ax.boxplot(data, tick_labels=["Group A", "Group B", "Group C"])
ax.set_ylabel("Score")
ax.set_title("Scores by group")
plt.show()
Multiple boxplots are helpful when comparing experiments, classrooms, products, or model results. If bars would be a better fit for aggregate values, compare this with Matplotlib bar charts.
Add Notches and Horizontal Orientation
Notches visualize an approximate confidence interval around the median. Horizontal orientation is useful when category labels are long or when values are easier to scan left to right.
import matplotlib.pyplot as plt

fig, ax = plt.subplots()
ax.boxplot(
    data,
    notch=True,
    orientation="horizontal",
    tick_labels=["Baseline", "Experiment", "Follow up"],
)
ax.set_xlabel("Score")
ax.set_title("Horizontal notched boxplot")
plt.show()
Use notches as a visual aid, not as a full statistical test. When medians are important to the story, label the chart clearly and keep the axis scale consistent.
Fill Boxes With Custom Colors
Set patch_artist=True when you want filled boxes. The returned dictionary contains the artists for boxes, medians, whiskers, caps, and fliers, so you can style each part separately.
import matplotlib.pyplot as plt

colors = ["#9ecae1", "#a1d99b", "#fdd0a2"]
labels = ["Group A", "Group B", "Group C"]

fig, ax = plt.subplots()
box = ax.boxplot(data, patch_artist=True, tick_labels=labels)

for patch, color in zip(box["boxes"], colors):
    patch.set_facecolor(color)

ax.set_title("Colored Matplotlib boxplot")
plt.show()
Color should support comparison rather than distract from the distribution. Keep related charts consistent, and avoid using too many colors when the labels already identify each group.
Customize Whiskers and Outliers
The whis argument controls whisker length. The default is 1.5, meaning 1.5 times the interquartile range. You can also pass percentiles, such as (5, 95), when that better matches the analysis.
import matplotlib.pyplot as plt

flierprops = {
    "marker": "o",
    "markerfacecolor": "#d62728",
    "markersize": 6,
    "alpha": 0.7,
}

fig, ax = plt.subplots()
ax.boxplot(data, whis=(5, 95), showfliers=True, flierprops=flierprops)
ax.set_title("Boxplot with percentile whiskers")
plt.show()
Outlier markers are still data points, not automatic errors. Before removing them, check whether they are valid observations, entry mistakes, or meaningful extreme cases. The guide to Matplotlib markers covers marker styling in more detail.
Show Means and Style Medians
Boxplots emphasize medians, but you can also show means. This is useful when skew makes the mean and median noticeably different.
import matplotlib.pyplot as plt

medianprops = {"color": "black", "linewidth": 2}
meanprops = {"marker": "D", "markerfacecolor": "white", "markeredgecolor": "black"}

fig, ax = plt.subplots()
ax.boxplot(
    data,
    showmeans=True,
    medianprops=medianprops,
    meanprops=meanprops,
    tick_labels=["A", "B", "C"],
)
ax.set_title("Boxplot with means and styled medians")
plt.show()
If you need to display numeric summaries beside the plot, a small table can help. The article on Matplotlib tables shows how to add structured values to a figure.
Common Mistakes
The most common mistake is using a boxplot for categories with too few observations. A boxplot is more useful when each group has enough values for quartiles to mean something. Another mistake is hiding outliers without explaining why. A third is mixing groups with different units on the same y-axis.
Use a Matplotlib boxplot when you want a compact distribution summary. Use it for medians, quartiles, spread, and outliers; use a histogram or scatter plot when the shape of every observation matters. Before publishing a comparison, check sample sizes and whether every group was measured the same way. Document those choices in the chart caption. For quick supporting statistics, the guide to averages in Python can help summarize the same data numerically.
References
- Matplotlib Axes.boxplot documentation
- Matplotlib boxplot examples
- Matplotlib colored boxplot example
Build A Readable Boxplot
Use a list of arrays when comparing groups and give the groups labels. A figure size that matches the number of groups prevents cramped tick labels. Store the returned artist dictionary when you need to style individual parts consistently.
import matplotlib.pyplot as plt

values = [[12, 14, 15, 18, 21], [9, 11, 13, 16, 30]]
fig, ax = plt.subplots(figsize=(7, 4))
ax.boxplot(values, labels=["control", "variant"],
           patch_artist=True, showmeans=True)
ax.set_ylabel("response")
fig.tight_layout()
plt.show()
Style The Statistical Parts
With patch_artist=True, boxes are Patch objects and can receive face colors. Medians, whiskers, caps, fliers, and means are separate artist lists. Use restrained contrast and preserve a legend or caption when color carries meaning.
artists = ax.boxplot(values, patch_artist=True, showmeans=True)
for box in artists["boxes"]:
    box.set_facecolor("#d9eaf7")
for median in artists["medians"]:
    median.set_color("#c05621")
for mean in artists["means"]:
    mean.set_marker("D")
Whiskers, Notches, And Orientation
The default whiskers use the 1.5 IQR rule. Pass whis when a percentile or full-range policy is more appropriate, and use notch=True only when the uncertainty interpretation is understood. For horizontal plots, label the numeric axis and keep category labels easy to scan.
fig, ax = plt.subplots(figsize=(7, 4))
ax.boxplot(values, vert=False, whis=(5, 95),
           notch=True, showfliers=True)
ax.set_xlabel("response")
fig.tight_layout()
Matplotlib’s boxplot API defines the returned artists, whisker rules, notches, means, and orientation options.
For related figure layout and styling, compare subplot spacing, tight layout, and colorbars when building a chart that remains readable.
Frequently Asked Questions
What does a Matplotlib boxplot show?
The box spans the first and third quartiles, the line marks the median, whiskers show the configured range, and fliers represent points outside that range.
How do I color a Matplotlib boxplot?
Pass patch_artist=True and style the returned boxes, medians, whiskers, caps, and fliers through the dictionary returned by boxplot.
How do I show the mean?
Pass showmeans=True and customize the mean marker through meanprops or the returned means artists.
How do I make a horizontal boxplot?
Use vert=False in older Matplotlib code or the current orientation parameter supported by your installed Matplotlib version, then label the numeric axis clearly.

Informative on making boxplots, is there any way to add a legend indicating the mean and median
Hi, thank you for your comment.
I’ve added a section describing how you can add a legend in your boxplots. Try the same for mean and median.
Please let us know if you have any other doubt. We’ll try our best to resolve them.