Quick answer: Choose a Python visualization library by output, audience, interactivity, statistical workflow, grammar, data size, export, accessibility, and deployment. Matplotlib and Seaborn suit many static scientific charts, while Plotly, Altair, and Bokeh support different interactive workflows.
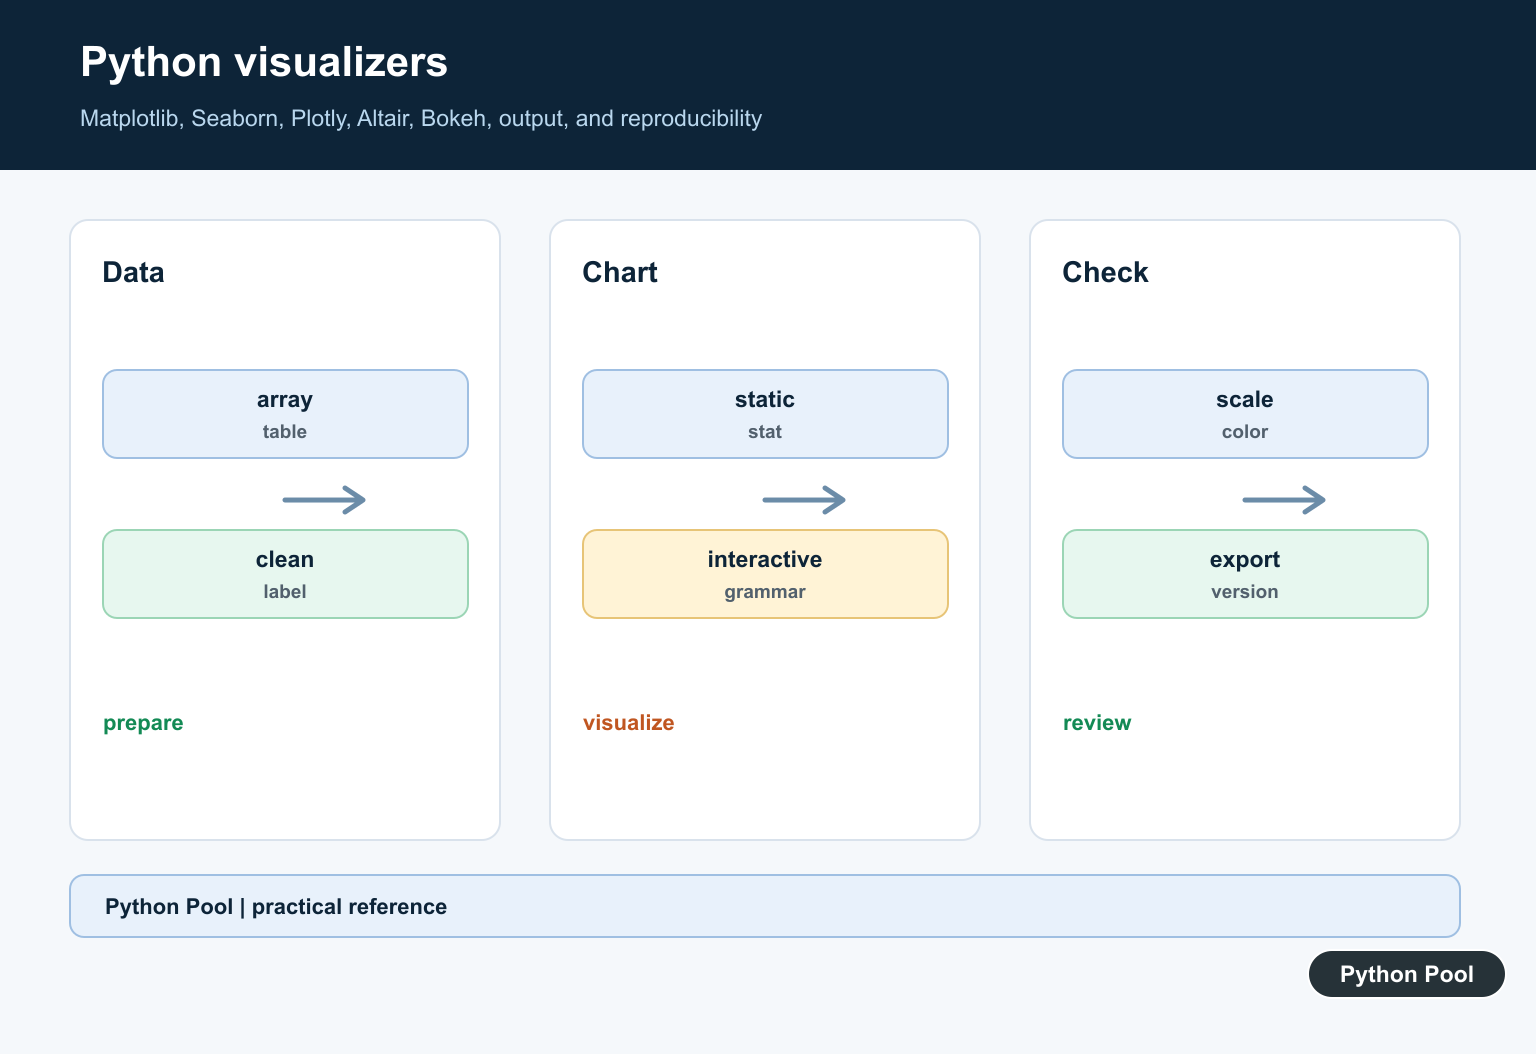
Python visualization means turning data into charts that help people compare values, see patterns, and spot outliers. The main choices are not about which library is famous; they are about the job. Matplotlib is flexible and stable, Seaborn is strong for statistical plots, Plotly is useful for interactive charts, and pandas can produce quick plots directly from DataFrames.
A good visualizer starts with a clear question. Are you comparing categories, showing a trend over time, checking a distribution, or exploring relationships between columns? Choose the chart type and library after that question is clear.
Do not start by adding colors or effects. First confirm that the chart answers the question honestly. A simple labeled bar chart is often better than an interactive chart that hides the scale, drops missing values silently, or makes comparisons hard to read.
For repeated reporting, keep visualization code close to the data-cleaning step. That makes it easier to verify units, filters, date ranges, and grouping choices before the figure is exported.
Primary references include the Matplotlib pyplot tutorial, Seaborn introduction, Plotly Python documentation, pandas visualization guide, and Python csv documentation.
Start With Matplotlib
Matplotlib is the foundation for many Python charting workflows. Use it when you need control over labels, axes, layout, and saved figures.
import matplotlib.pyplot as plt

months = ["Jan", "Feb", "Mar", "Apr"]
sales = [12, 18, 15, 24]

plt.plot(months, sales, marker="o")
plt.title("Monthly sales")
plt.xlabel("Month")
plt.ylabel("Sales")
plt.tight_layout()
This line chart is a good fit for ordered data. Use clear axis labels so the figure can stand on its own in reports.
Matplotlib is also the safest default when you need predictable saved output. It works well in scripts, notebooks, automated reports, and server-side jobs where a browser is not available.
Use Seaborn For Statistical Plots
Seaborn builds on Matplotlib and makes common statistical charts concise. It is especially useful for distributions and grouped comparisons.
import seaborn as sns

tips = sns.load_dataset("tips")

axis = sns.histplot(data=tips, x="total_bill", bins=20)
axis.set_title("Distribution of total bills")
axis.set_xlabel("Total bill")
If histplot is missing, the local Seaborn version is likely old. Update the package or use an older function that matches the installed version.
Use pandas For Quick Checks
pandas plotting is convenient when the data is already in a DataFrame and you need a quick visual check.
import pandas as pd

frame = pd.DataFrame({
    "month": ["Jan", "Feb", "Mar", "Apr"],
    "sales": [12, 18, 15, 24],
})

axis = frame.plot(x="month", y="sales", kind="bar", legend=False)
axis.set_ylabel("Sales")
Use pandas plots during exploration, then switch to Matplotlib, Seaborn, or Plotly when the chart needs more polish or interactivity.
Create Interactive Charts With Plotly
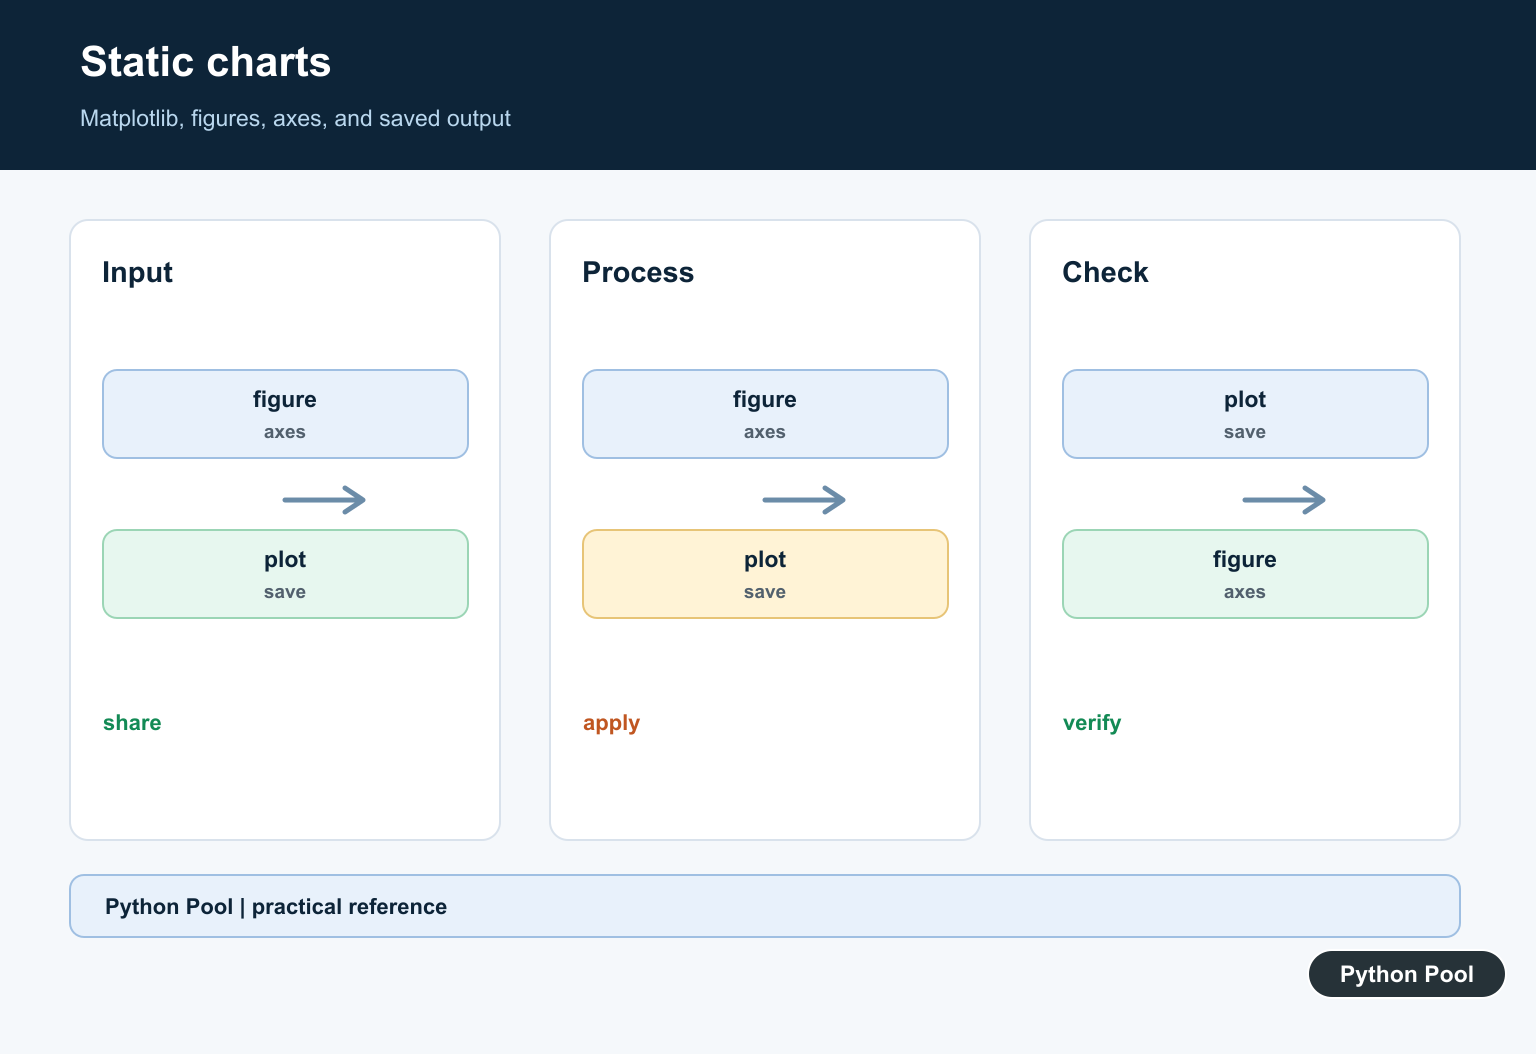
Plotly is useful when users need hover labels, zooming, or charts embedded in dashboards and notebooks.
import plotly.express as px

data = {
    "month": ["Jan", "Feb", "Mar", "Apr"],
    "sales": [12, 18, 15, 24],
}

figure = px.line(data, x="month", y="sales", markers=True, title="Monthly sales")
figure.update_layout(xaxis_title="Month", yaxis_title="Sales")
Interactive charts are helpful for exploration, but static PNG or SVG exports are often better for documents and long-term reports.
Use Plotly when the audience needs to inspect points, zoom into a time range, or hover for details. If the audience only needs one conclusion, a static chart is usually easier to review.
Read Data Before Plotting
Many chart problems start before plotting. Read the data, inspect rows, and convert values before building the figure.
import csv

rows = []
with open("sales.csv", newline="", encoding="utf-8") as handle:
    reader = csv.DictReader(handle)
    for row in reader:
        rows.append({"month": row["month"], "sales": int(row["sales"])})

print(rows[:3])
Check missing values and unexpected text before plotting. A chart can look wrong simply because one column was read as strings.
Save A Figure
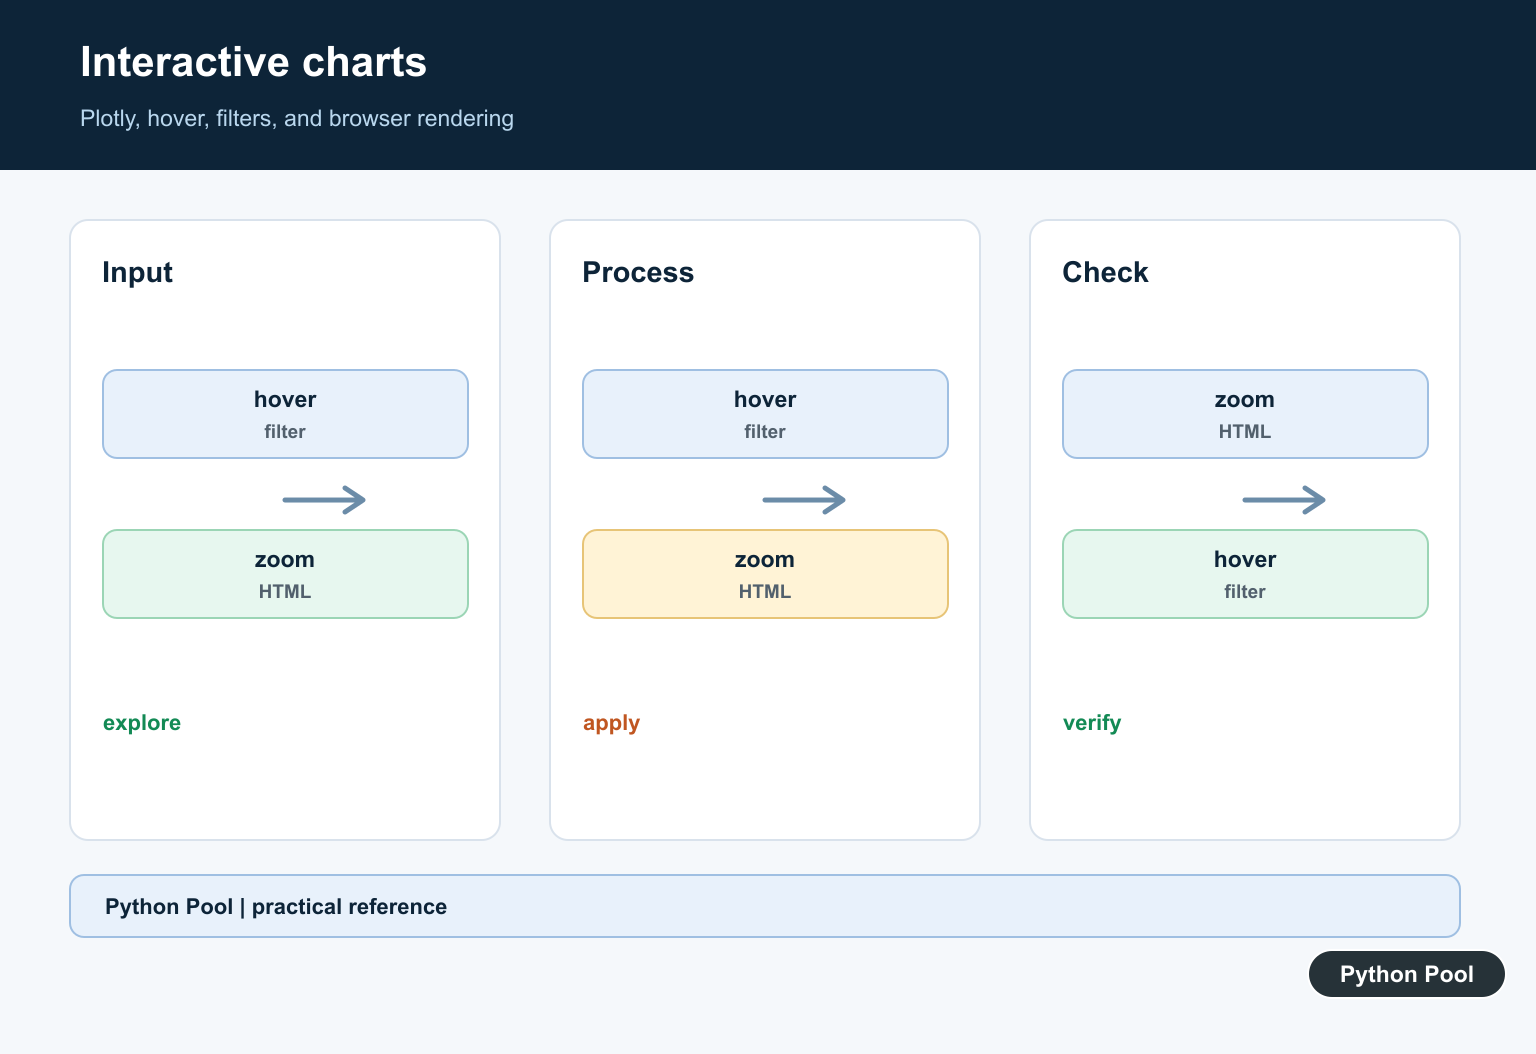
For articles, reports, and dashboards, save charts with predictable dimensions and a clear filename.
import matplotlib.pyplot as plt

labels = ["A", "B", "C"]
values = [5, 8, 3]

plt.bar(labels, values)
plt.title("Category comparison")
plt.tight_layout()
plt.savefig("category-comparison.png", dpi=150)
Use filenames that describe the chart. Avoid overwriting important figures during automated runs by writing outputs into a dedicated directory.
Practical Checklist
Use Matplotlib when you need detailed control, Seaborn for statistical views, Plotly for interactive exploration, and pandas plotting for quick DataFrame checks. The best library is the one that answers the question with the least confusing code.
Choose chart types deliberately. Use line charts for ordered trends, bar charts for categories, histograms for distributions, scatter plots for relationships, and heatmaps for matrix-style comparisons.
Before publishing a chart, verify the data source, axis labels, units, title, colors, and export size. A clean chart should make the important pattern easier to see without hiding the assumptions behind the data.
Also test charts with realistic edge cases: empty data, one category, very long labels, extreme values, and missing dates. Visualization code that handles those cases is more reliable in dashboards and scheduled reports.
Define The Output
Decide whether the result is a publication figure, notebook exploration, embedded dashboard, web interaction, report image, or accessible data view.
Use Matplotlib As A Foundation
Matplotlib provides broad static control and integrates with scientific Python. Explicit figures, axes, labels, units, and layout make output easier to reproduce.
Add Statistical Defaults
Seaborn can make common statistical plots readable with less code, but verify aggregations, uncertainty, categories, and color choices rather than accepting defaults blindly.
Choose Interactive Tools
Plotly, Altair, and Bokeh differ in grammar, callbacks, rendering, data handling, export, and hosting. Prototype the hardest interaction before selecting a library.
Make Charts Honest
Use meaningful scales, readable labels, uncertainty where appropriate, color that remains interpretable, and annotations that do not imply unsupported conclusions.
Reproduce And Test
Record versions and data preparation, set chart options deliberately, validate representative output, and test export, resizing, empty data, and accessibility requirements.
Use the official Matplotlib documentation and the documentation for the interactive library selected. Related Python Pool references include array preparation and testing.
For related visualization workflows, compare array preparation, chart configuration, and output tests before choosing a library.
Frequently Asked Questions
Which Python library is best for data visualization?
Matplotlib is a flexible static foundation, Seaborn adds statistical defaults, and Plotly, Altair, or Bokeh can suit interactive or declarative workflows.
Is Matplotlib still useful?
Yes. It supports broad static output, fine-grained control, and integration with many scientific Python workflows.
How do I choose an interactive visualization library?
Consider the target environment, chart grammar, data size, callbacks, export requirements, accessibility, and how the result will be maintained.
How can I make charts reproducible?
Pin or record library versions, keep data preparation explicit, set chart parameters deliberately, and test representative output or specifications.
