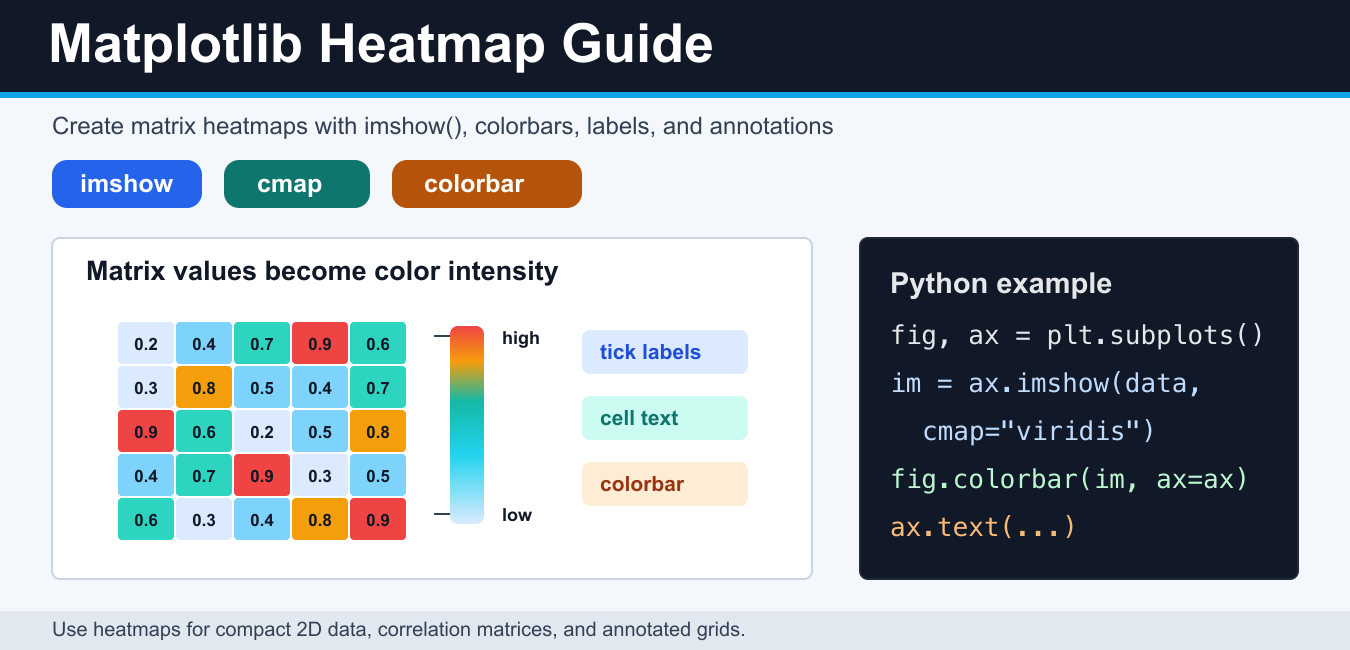
Quick answer: Use ax.imshow(matrix) to map a two-dimensional array to color, add fig.colorbar(image, ax=ax) to explain the scale, set tick labels deliberately, and annotate cells only when the matrix is small enough to remain readable.
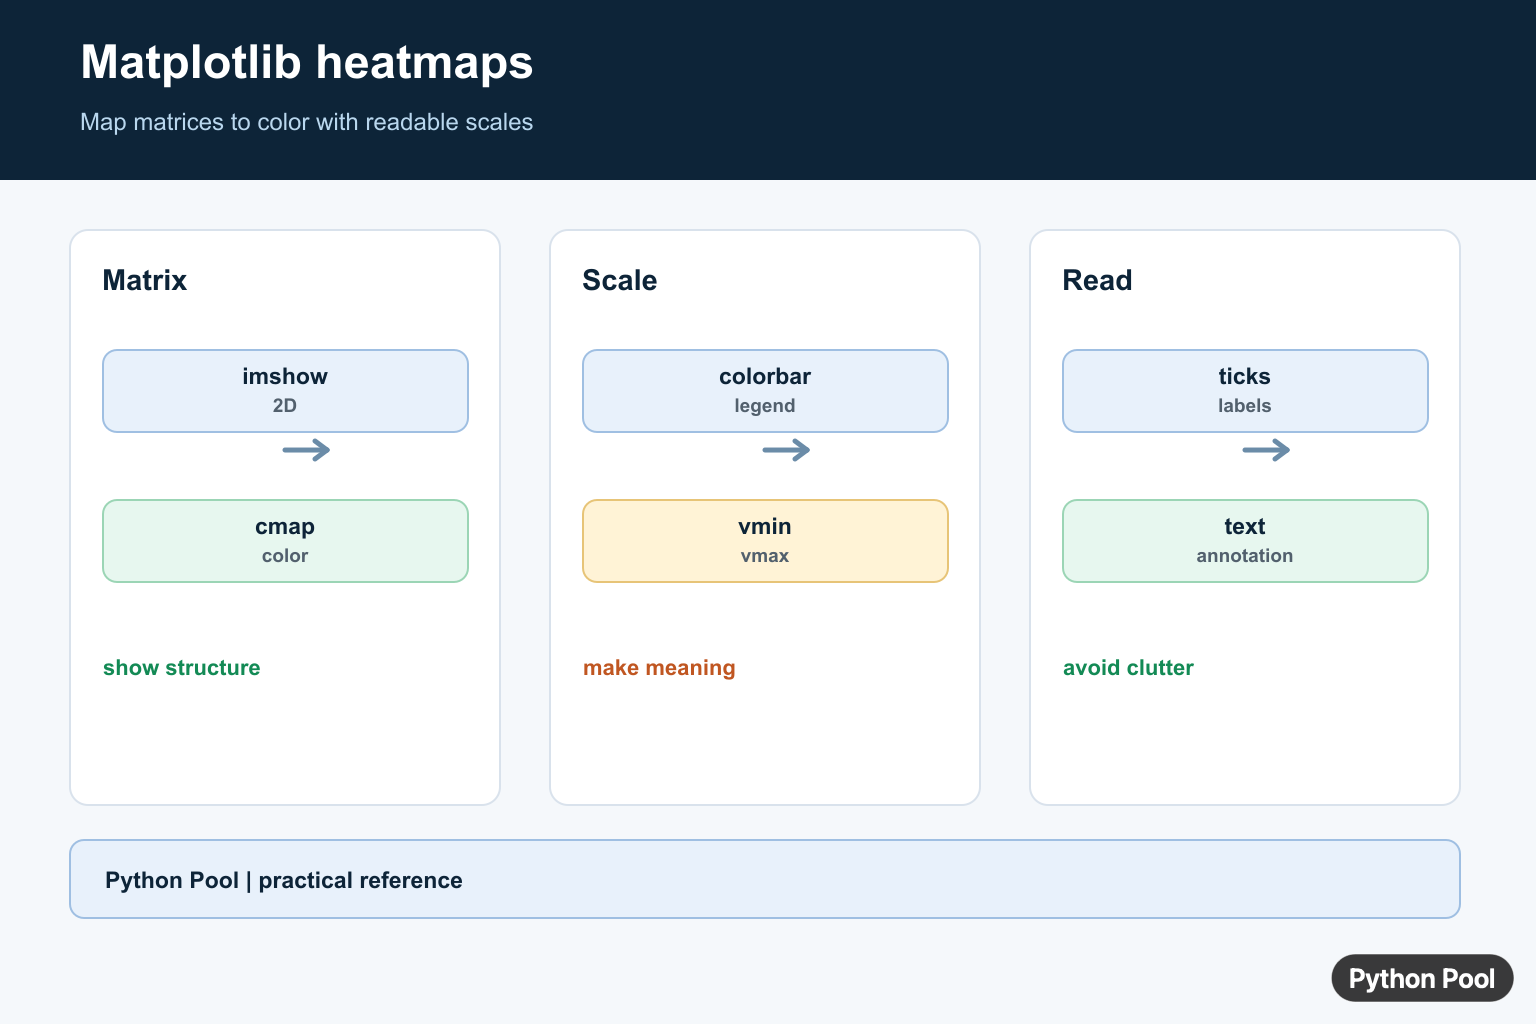
A Matplotlib heatmap displays a 2D array as colored cells. It is useful for correlation matrices, confusion matrices, calendar-style grids, feature comparisons, and any small matrix where color intensity makes patterns easier to scan.
The most common Matplotlib heatmap workflow is ax.imshow(data), followed by a colorbar, tick labels, and optional text annotations inside each cell. Use a heatmap when the color pattern matters as much as the exact values.
Before plotting, make sure the input really is a rectangular matrix. Each row should have the same number of columns, and each value should be numeric. If the data comes from a DataFrame, select the numeric columns first and decide whether missing values should be filled, dropped, or left out of the visualization.
Create a basic Matplotlib heatmap
Start with a 2D NumPy array and pass it to imshow(). The returned image object is then used by fig.colorbar() so readers can understand the value scale.
import matplotlib.pyplot as plt
import numpy as np

data = np.array([
    [0.2, 0.4, 0.7, 0.9],
    [0.3, 0.8, 0.5, 0.4],
    [0.9, 0.6, 0.2, 0.5],
])

fig, ax = plt.subplots(figsize=(6, 4))
im = ax.imshow(data, cmap="viridis")
fig.colorbar(im, ax=ax, label="score")

ax.set_title("Basic Matplotlib heatmap")
plt.show()
The official pyplot.imshow documentation and Axes.imshow documentation cover the main arguments, including cmap, interpolation, vmin, and vmax. Python Pool also has a focused guide to Matplotlib imshow().
Add row and column labels
A heatmap is easier to read when the rows and columns are labeled. Set x-ticks and y-ticks to match the matrix shape, then pass the label text.
rows = ["Model A", "Model B", "Model C"]
columns = ["Jan", "Feb", "Mar", "Apr"]

fig, ax = plt.subplots(figsize=(7, 4))
im = ax.imshow(data, cmap="magma")
fig.colorbar(im, ax=ax)

ax.set_xticks(range(len(columns)), labels=columns)
ax.set_yticks(range(len(rows)), labels=rows)
ax.set_xlabel("Month")
ax.set_ylabel("Model")

plt.show()
If labels are long, rotate them and increase the figure width. The Matplotlib figsize guide explains how to choose a canvas size before exporting.
Annotate heatmap cells
Use ax.text() to print each value inside the matching cell. This works best for small matrices. For large matrices, annotations can make the figure unreadable.
fig, ax = plt.subplots(figsize=(7, 4))
im = ax.imshow(data, cmap="YlGnBu", vmin=0, vmax=1)
fig.colorbar(im, ax=ax)

for row in range(data.shape[0]):
    for col in range(data.shape[1]):
        value = data[row, col]
        ax.text(col, row, f"{value:.1f}", ha="center", va="center", color="black")

ax.set_title("Annotated heatmap")
plt.show()
The official Matplotlib annotated heatmap example shows a reusable helper approach. For text placement details, see the Axes.text documentation and Python Pool’s Matplotlib text guide.
Choose a colormap and scale
The colormap controls how values map to colors. Sequential colormaps such as viridis, magma, and YlGnBu are good for low-to-high values. Diverging colormaps such as coolwarm are better when values move around a meaningful center, such as zero.
fig, ax = plt.subplots(figsize=(6, 4))
im = ax.imshow(data, cmap="coolwarm", vmin=-1, vmax=1)
fig.colorbar(im, ax=ax, label="correlation")
plt.show()
Use vmin and vmax when several heatmaps must share the same scale. The official Matplotlib colormap guide explains how to pick perceptually useful colormaps. For more examples, see Python Pool’s guides to Matplotlib cmap and custom colormaps.
Add and format the colorbar
The colorbar is not decoration; it explains the numeric meaning of each color. Add a label and keep the scale consistent when comparing plots.
fig, ax = plt.subplots(figsize=(6, 4))
im = ax.imshow(data, cmap="viridis", vmin=0, vmax=1)
colorbar = fig.colorbar(im, ax=ax, fraction=0.046, pad=0.04)
colorbar.set_label("normalized value")
plt.show()
The official pyplot.colorbar documentation lists the sizing and placement arguments. Python Pool’s Matplotlib colorbar guide covers more colorbar examples.
Plot a correlation matrix heatmap
Correlation heatmaps are common in data analysis. Calculate the correlation matrix first, then plot that matrix with a diverging colormap centered around zero. This keeps positive and negative relationships visually distinct.
import matplotlib.pyplot as plt
import pandas as pd

frame = pd.DataFrame({
    "sales": [12, 18, 21, 25, 30],
    "profit": [4, 7, 9, 8, 12],
    "cost": [8, 11, 13, 17, 19],
})

corr = frame.corr(numeric_only=True)

fig, ax = plt.subplots(figsize=(5, 4))
im = ax.imshow(corr, cmap="coolwarm", vmin=-1, vmax=1)
fig.colorbar(im, ax=ax, label="correlation")
ax.set_xticks(range(len(corr.columns)), labels=corr.columns, rotation=45, ha="right")
ax.set_yticks(range(len(corr.index)), labels=corr.index)

plt.show()
The Pandas DataFrame.corr documentation explains the correlation calculation. If you need binned density instead of a matrix heatmap, use Matplotlib 2D histograms.
imshow() vs pcolormesh()
imshow() is usually best for regular matrices where each cell has the same size. Use pcolormesh() when the grid has explicit x/y boundaries or uneven cell spacing.
x = np.arange(5)
y = np.arange(4)
values = np.array([
    [1, 2, 3, 4],
    [2, 4, 6, 8],
    [3, 6, 9, 12],
])

fig, ax = plt.subplots(figsize=(6, 4))
mesh = ax.pcolormesh(x, y, values, cmap="plasma", shading="auto")
fig.colorbar(mesh, ax=ax)
plt.show()
For grid-based pseudocolor plots, see Python Pool’s Matplotlib pcolormesh guide and the NumPy arange documentation for simple grid coordinates.
Common heatmap mistakes
Using too many annotations. Text labels are helpful for small grids but noisy for large matrices. If the matrix has dozens of rows, rely on the colorbar and provide exact values somewhere else.
Comparing heatmaps with different scales. Set the same vmin and vmax when figures should be compared.
Picking a misleading colormap. Use sequential colormaps for ordered values and diverging colormaps for values around a center.
Forgetting layout. Tick labels and colorbars need space. Increase figure size or use layout tools before saving.
Conclusion
Use imshow() for most Matplotlib heatmaps. Add a colorbar, label the rows and columns, choose a colormap that matches the data, and annotate cells only when the matrix is small enough to remain readable. For irregular grids, switch to pcolormesh().
Create A Heatmap With imshow()
imshow() renders matrix rows and columns as an image. Keep the data shape explicit and choose interpolation according to the use case: nearest is often clearer for discrete cells, while a smooth interpolation can hide boundaries.
import matplotlib.pyplot as plt
import numpy as np

data = np.array([[1, 2, 3], [3, 2, 1], [2, 4, 2]])
fig, ax = plt.subplots()
image = ax.imshow(data, cmap="viridis", interpolation="nearest")
fig.colorbar(image, ax=ax, label="value")
plt.show()
Add Ticks And Labels
Tick positions identify columns and rows, while tick labels describe the real categories. Set them from the data model rather than relying on numeric indexes, and rotate long x labels so they do not collide.
import matplotlib.pyplot as plt
import numpy as np

data = np.array([[0.2, 0.8], [0.5, 0.1]])
fig, ax = plt.subplots()
image = ax.imshow(data, vmin=0, vmax=1, cmap="Blues")
ax.set_xticks([0, 1], labels=["Model A", "Model B"])
ax.set_yticks([0, 1], labels=["Train", "Test"])
fig.colorbar(image, ax=ax)
plt.show()
Annotate Small Matrices
Cell annotations are useful when exact values matter, but many labels make a large heatmap noisy. Format values consistently and choose text color from the cell contrast when the same figure must remain readable across a wide range.
import matplotlib.pyplot as plt
import numpy as np

data = np.array([[0.2, 0.8], [0.5, 0.1]])
fig, ax = plt.subplots()
image = ax.imshow(data, cmap="RdBu_r", vmin=0, vmax=1)
for row in range(data.shape[0]):
    for column in range(data.shape[1]):
        ax.text(column, row, f"{data[row, column]:.2f}", ha="center", va="center")
fig.colorbar(image, ax=ax)
plt.show()
Plot Correlations With An Honest Scale
Correlation matrices have a meaningful zero and usually span negative to positive values. Use a diverging colormap and consistent vmin=-1 and vmax=1 so colors mean the same thing across comparable figures. Do not let a single outlier silently redefine the scale.
import matplotlib.pyplot as plt
import numpy as np

correlation = np.array([[1.0, 0.7, -0.2], [0.7, 1.0, 0.1], [-0.2, 0.1, 1.0]])
fig, ax = plt.subplots()
image = ax.imshow(correlation, cmap="coolwarm", vmin=-1, vmax=1)
fig.colorbar(image, ax=ax, label="correlation")
plt.show()
Matplotlib’s official imshow() reference documents image extent, interpolation, normalization, and colormaps; use the colorbar() API to explain the mapping.
For related heatmap presentation, compare colorbars, imshow(), and Matplotlib annotations when adding scale and exact values.
Frequently Asked Questions
How do I make a heatmap in Matplotlib?
Pass a two-dimensional array to ax.imshow() and add a colorbar that explains the mapping from values to colors.
How do I add labels to a Matplotlib heatmap?
Set tick positions and labels with set_xticks(), set_xticklabels(), set_yticks(), and set_yticklabels().
How do I annotate heatmap cells?
Loop over matrix coordinates and call ax.text() with a formatted value, adjusting color and contrast for the cell background.
Which colormap should I use for a correlation matrix?
Use a diverging colormap centered at zero when negative and positive relationships have different meanings, and keep the scale consistent across plots.
