
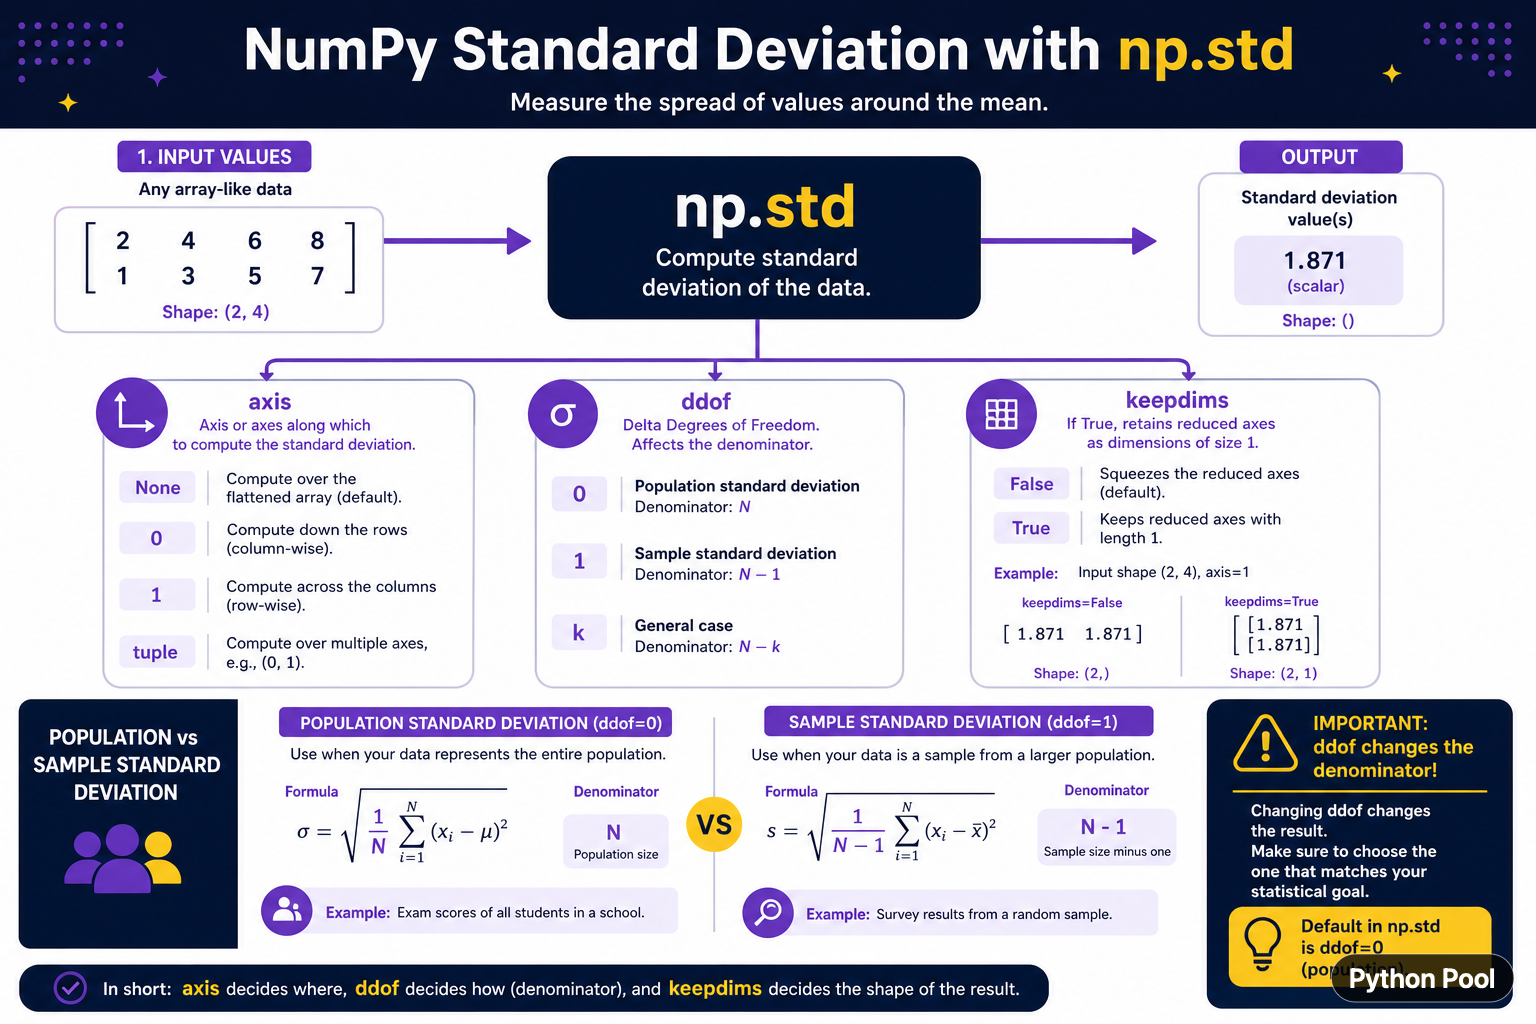
NumPy std() measures how far values spread around their mean. The most important options are axis, which chooses the dimension to reduce; ddof, which changes the denominator; and keepdims, which preserves reduced dimensions for broadcasting. A standard deviation result is only meaningful when the population or sample interpretation and the numeric dtype are clear.
Quick answer
Call np.std(values) for one standard deviation over all values. Use axis=0 or axis=1 for column or row reductions. The default ddof=0 computes population standard deviation; use ddof=1 for the common sample estimate. Use keepdims=True when the reduced result must broadcast back over the original array.
The official NumPy std reference documents the axis, degrees-of-freedom, dtype, and keepdims behavior. Do not choose ddof merely because one result looks closer to an expected number; choose it from the statistical meaning of the data.
Calculate a scalar standard deviation
With no axis, NumPy treats the array as one collection and returns a scalar. The mean is calculated first, then squared deviations are aggregated and divided according to ddof.
import numpy as np

values = np.array([2.0, 4.0, 6.0, 8.0])
population_std = np.std(values)
sample_std = np.std(values, ddof=1)

print(population_std)
print(sample_std)
For a complete population, ddof=0 is usually the direct description. For a sample used to estimate a larger population, ddof=1 is a common unbiased variance correction. The choice belongs in the analysis specification.
Reduce along an axis
A two-dimensional array can be reduced by rows or columns. Read the axis in terms of which dimension disappears. In a matrix with shape (rows, columns), axis=0 combines rows and returns one result per column, while axis=1 combines columns and returns one result per row.
import numpy as np

values = np.array([
    [1.0, 10.0],
    [2.0, 20.0],
    [3.0, 30.0],
])

by_column = np.std(values, axis=0)
by_row = np.std(values, axis=1)

print(by_column)
print(by_row)
Check the result shape before using it in a later calculation. Many broadcasting bugs come from choosing a valid axis that is semantically the wrong one.
Use keepdims for broadcasting
keepdims=True leaves the reduced axis in the result with length one. This makes the result shape compatible with the original array and is useful when subtracting a mean or standard deviation from each row or column.
import numpy as np

values = np.array([
    [1.0, 2.0, 3.0],
    [4.0, 5.0, 6.0],
])
row_std = np.std(values, axis=1, keepdims=True)
centered = values / row_std

print(row_std.shape)
print(centered.shape)
Dividing by a zero standard deviation may produce warnings or invalid values for constant rows. Handle that case according to the model rather than replacing it silently.
Choose ddof deliberately
ddof is subtracted from the number of observations in the denominator. For N values, NumPy uses N - ddof. A high ddof can make the denominator zero or negative for a small sample, so validate it when it comes from configuration.
import numpy as np

values = np.array([4.0, 5.0, 6.0, 7.0])
for ddof in (0, 1):
    print(ddof, np.std(values, ddof=ddof))
Use the same ddof policy for related statistics. Mixing population and sample formulas across columns can make comparisons misleading even when each individual call is valid.
Control dtype and precision
Floating-point precision affects mean and variance calculations. Integer input is generally promoted for the calculation, while single-precision data may benefit from an explicit higher-precision accumulator when the values are large or nearly equal.
import numpy as np

values = np.array([1000000.1, 1000000.2, 1000000.3], dtype=np.float32)
default_std = np.std(values)
high_precision_std = np.std(values, dtype=np.float64)

print(default_std)
print(high_precision_std)
Choose a dtype from the scale of the data and the accuracy required. A more precise intermediate does not fix a flawed sample definition or invalid missing-value handling.
Handle missing values explicitly
Ordinary np.std() propagates NaN values. If missing values should be ignored, use a documented nan-aware operation such as np.nanstd() and report how many observations remain.
import numpy as np

values = np.array([2.0, np.nan, 6.0, 8.0])
regular = np.std(values)
ignore_missing = np.nanstd(values)

print(regular)
print(ignore_missing)
Ignoring missing values is not always statistically valid. Record the missingness policy and minimum sample size so an apparently precise result does not hide an insufficient dataset.
Common mistakes
- Using
ddof=1without deciding whether data is a sample. - Reading axis direction backwards.
- Forgetting
keepdimswhen a result must broadcast. - Ignoring NaN propagation or silently dropping missing values.
- Using low precision for values with severe cancellation.
The reliable workflow is to define the statistical population, choose the reduction axis, set ddof, verify the result shape, and handle missing values explicitly. NumPy provides the calculation; the analysis must provide the meaning.
Interpret small and constant samples
A standard deviation computed from one observation is zero for a population calculation, but a sample calculation with ddof=1 has no degrees of freedom. Decide whether the result should be rejected, represented as missing, or handled by a domain-specific rule before sending it into a model.
Constant data also produces zero spread. Dividing by that value during normalization can create invalid results, so check the spread before using it as a scale factor. A zero is meaningful information, not an error that should always be replaced with one.
Keep units visible in the analysis. Standard deviation has the same units as the original measurements, while variance has squared units. This distinction matters when reporting the result or comparing columns with different scales.
For grouped or time-series data, write down which observations belong together before choosing axis. A correct reduction over the wrong groups is still a wrong statistic, and the resulting array shape may not reveal the mistake.
When comparing groups, report the sample count beside the standard deviation. A spread calculated from two observations should not be presented with the same confidence as one calculated from thousands, even when the numeric result has many decimal places.
Store the chosen ddof and axis alongside generated metrics when results may be reproduced later. Without that metadata, two identical arrays can produce different interpretations even if the calculation itself is deterministic.
For related descriptive statistics, compare NumPy variance and mean before choosing ddof and axis behavior. Read numpy variance and numpy mean for the related workflow.
Frequently Asked Questions
Frequently Asked Questions
How do I calculate standard deviation with NumPy?
Call np.std(values), then choose axis and ddof based on whether the data is a full population or a sample.
What does ddof mean in np.std()?
ddof is subtracted from the observation count in the denominator; ddof=0 is population behavior and ddof=1 is a common sample estimate.
What does axis do in np.std()?
axis selects the dimension or dimensions that are reduced, such as columns with axis=0 or rows with axis=1.
Why use keepdims=True?
keepdims preserves reduced axes with length one so the result can broadcast against the original array.
