
Quick answer: np.quantile(a, q) estimates a distribution cut point, where q is a probability between 0 and 1. Choose axis to define the series being summarized, choose method when the estimator matters, use nanquantile when NaN values should be ignored, and remember that multiple q values add a leading result dimension.
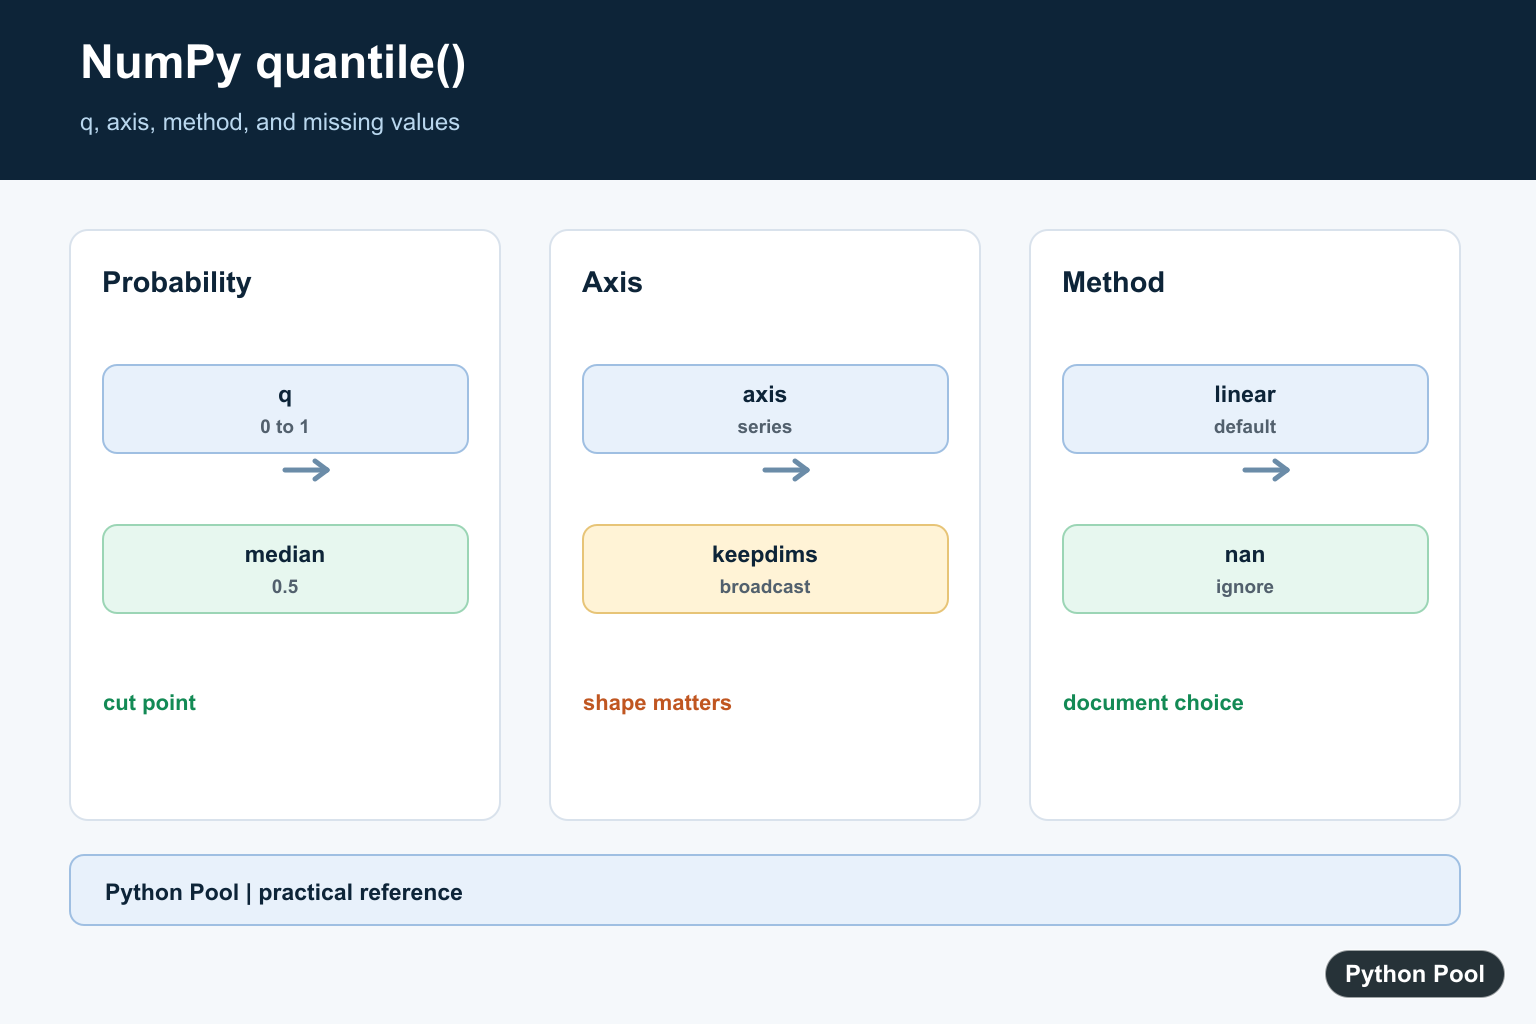
numpy.quantile() calculates cut points from an array using a q value between 0 and 1. A quantile summarizes where a value falls in a sorted distribution.
The official NumPy documentation covers numpy.quantile(), numpy.nanquantile(), and numpy.percentile().
Quantiles are useful for distribution summaries, model diagnostics, latency analysis, score thresholds, and outlier review. The 0.5 quantile is the median. The 0.25 and 0.75 quantiles are often used for quartiles.
The main difference from percentile() is scale. quantile() uses 0 to 1, while percentile() uses 0 to 100. Use whichever scale matches the rest of your code or report.
The most important choices are q, axis, and method. Choose them explicitly when the result will be reused in reports or tests.
Quantile output is a summary, not a count. If you need to know how many values are above a threshold, calculate the quantile first and then compare the array with that returned cut point.
For reporting, label the scale clearly. A q value of 0.95 is easy for programmers to read, but many readers expect to see “95th percentile” in chart labels or dashboard text.
Calculate One Quantile
Pass an array and one q value to calculate a single quantile.
import numpy as np

scores = np.array([10, 20, 30, 40, 50])

result = np.quantile(scores, 0.5)

print(result)
This prints the median because 0.5 is the halfway point.
The input does not need to be sorted. NumPy handles the ordering internally before calculating the cut point.
Use this form for a single median, lower quartile, upper quartile, or tail threshold.
For small datasets, the exact output can depend on the selected method. Keep the same method across repeated reports so changes in the number reflect the data, not a calculation setting.
Calculate Several Quantiles
Pass several q values to get several cut points in one call.
import numpy as np

scores = np.array([10, 20, 30, 40, 50])

quartiles = np.quantile(scores, [0.25, 0.5, 0.75])

print(quartiles)
This returns the lower quartile, median, and upper quartile.
Several quantiles are useful for compact summaries and box-plot style statistics.
Keep the requested q values in ascending order when people will read the output. NumPy returns results in the same order you request.
Calculate Column Quantiles
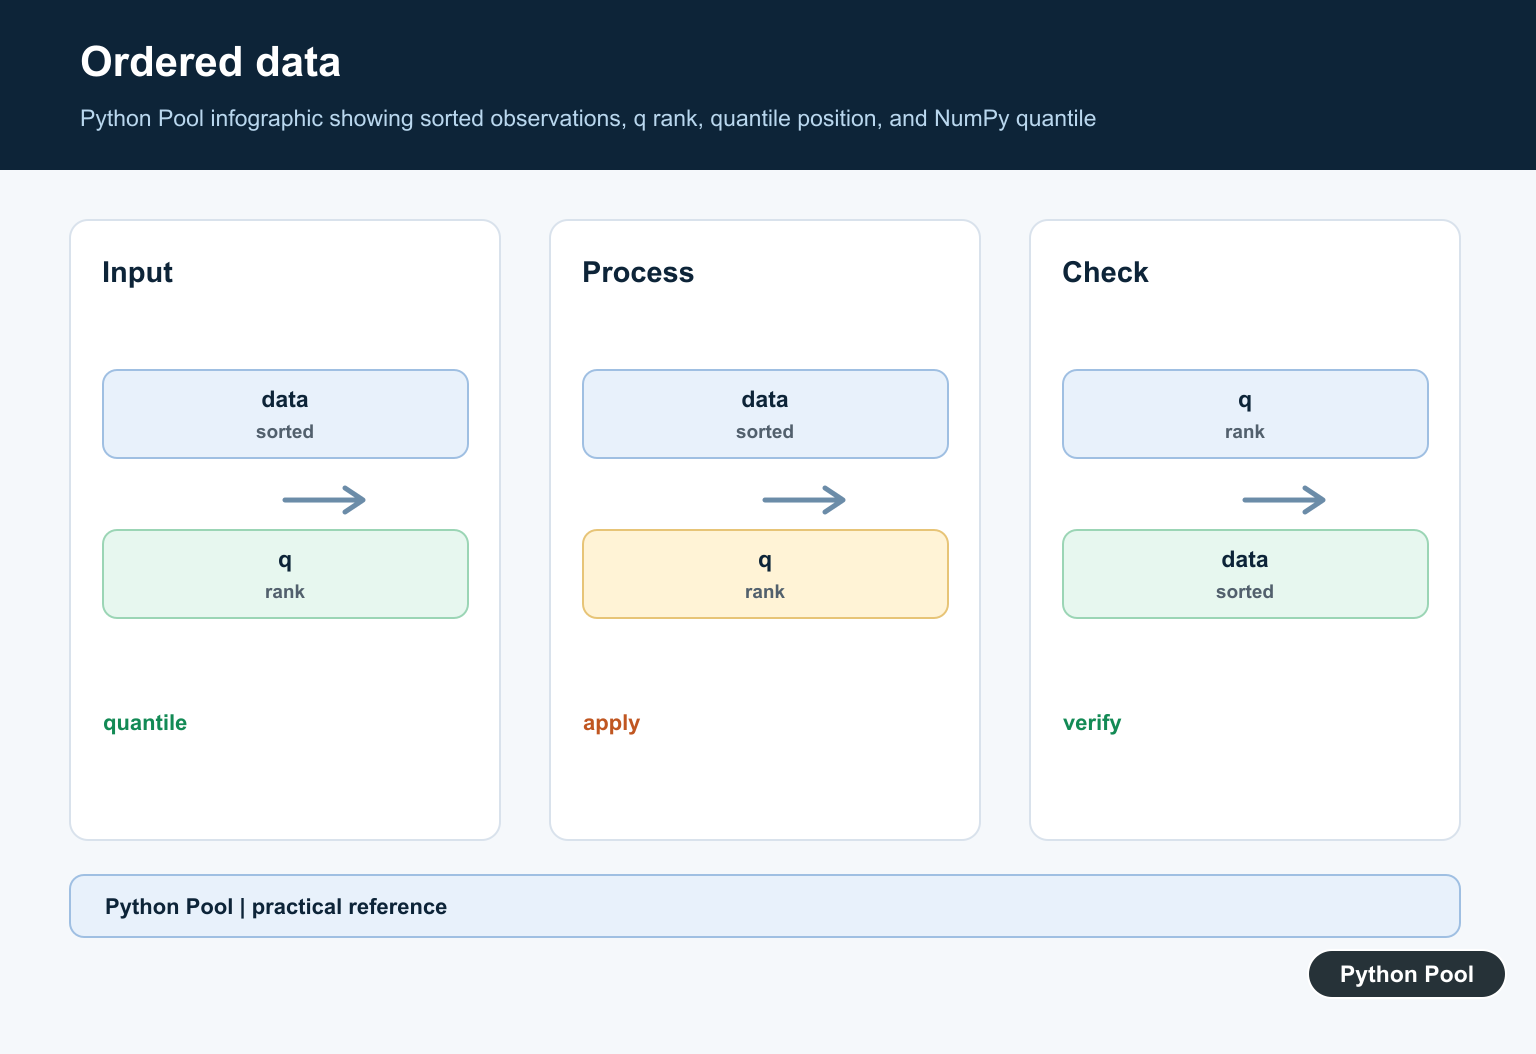
Use axis=0 to calculate quantiles down each column.
import numpy as np

data = np.array([
    [10, 80],
    [20, 85],
    [30, 90],
])

result = np.quantile(data, 0.5, axis=0)

print(result)
Each column receives its own median.
This is useful when columns represent separate measurements or model features.
If you omit axis, NumPy flattens the whole array first. That may be correct for a global summary, but it is not a per-column result.
Calculate Row Quantiles
Use axis=1 to calculate quantiles across each row.
import numpy as np

data = np.array([
    [10, 20, 30],
    [40, 50, 60],
])

result = np.quantile(data, 0.5, axis=1)

print(result)
Each row gets its own median.
Use row quantiles when each row is a separate record and the columns are repeated measurements for that record.
Check the shape before choosing an axis. The wrong axis can return numbers that look reasonable but answer the wrong question.
Choose A Method
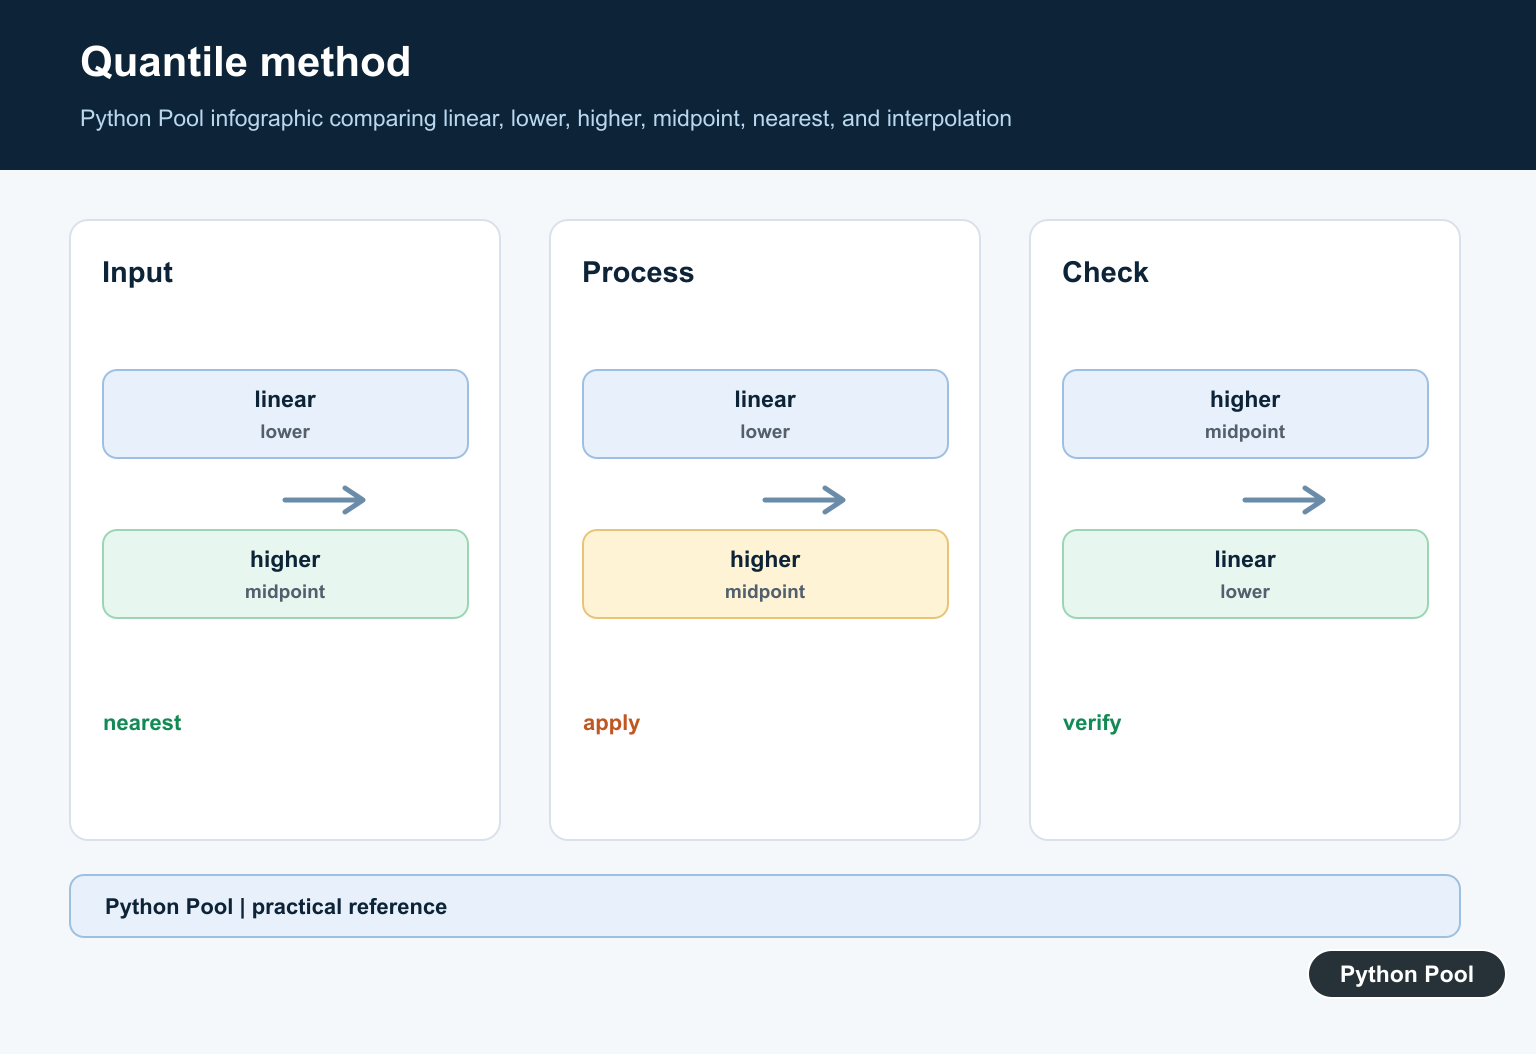
The method argument controls how NumPy handles positions that fall between two data points.
import numpy as np

scores = np.array([1, 2, 10, 20])

linear = np.quantile(scores, 0.25, method="linear")
nearest = np.quantile(scores, 0.25, method="nearest")

print(linear)
print(nearest)
The method choice matters most for small datasets and for cut points that do not land exactly on an existing value.
Use the default unless a report, test, or statistical process requires a specific definition.
When comparing with another tool, match the method before assuming one result is wrong.
This is especially important when matching spreadsheet output, database functions, or a business intelligence dashboard. Those tools may use a different quantile definition by default.
Ignore NaN Values
Use np.nanquantile() when missing values are represented by nan and should be skipped.
import numpy as np

data = np.array([10, 20, np.nan, 40, 50])

result = np.nanquantile(data, 0.5)

print(result)
This calculates the median from the non-NaN values.
Only use the NaN-aware function when skipping missing values is the correct rule for the dataset. If missing values represent failed measurements, document that choice.
For strict validation, it may be better to reject missing values before calculating quantiles.
That choice should be made before the summary step. Treating missing values as an error, skipping them, or filling them with a default all answer different questions.
Common quantile Mistakes
The first common mistake is using percentile scale with quantile(). Use 0.95, not 95, for the 95th percentile equivalent. Quantiles use a 0-to-1 scale; Calculate Percentiles with NumPy expresses the same rank positions as 0-to-100 percentiles and explains interpolation choices.
The second mistake is forgetting axis. Flattened, per-column, and per-row quantiles are different summaries.
The third mistake is mixing methods across reports. If method choice changes, small-sample results may change too.
In short, use np.quantile(data, q) with q from 0 to 1, pass several q values for quartiles, use axis for row or column summaries, and use np.nanquantile() only when missing values should be ignored.
Use q As A Probability
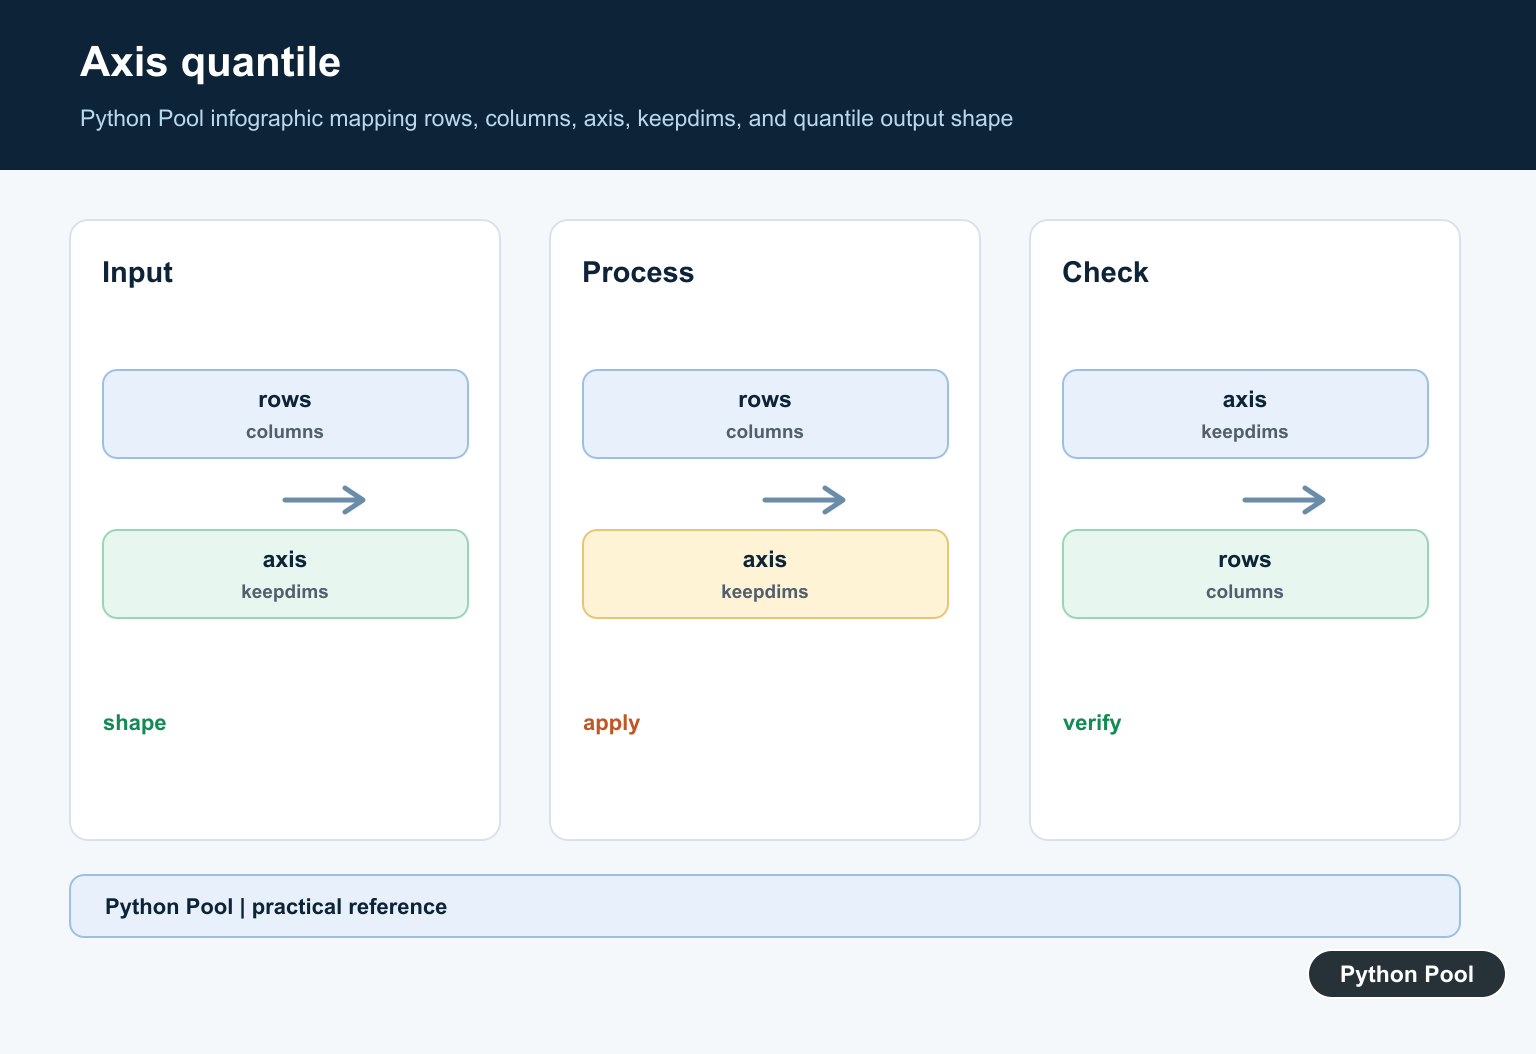
q=0 returns the lower endpoint, q=0.5 is the median under the default method, and q=1 returns the upper endpoint. Keep q in the inclusive range from 0 to 1; percentile uses the same idea on a 0-to-100 scale.
import numpy as np

values = np.array([10, 20, 30, 40, 50])
print(np.quantile(values, 0.25))
print(np.quantile(values, 0.5))
print(np.quantile(values, 0.75))
Set Axis And Keepdims
For matrix data, axis identifies the dimension being reduced. keepdims=True leaves a size-one dimension, which can make the result broadcast against the original array in later calculations.
import numpy as np

values = np.array([[1, 2, 3], [10, 20, 30]])
print(np.quantile(values, 0.5, axis=0))
print(np.quantile(values, 0.5, axis=1, keepdims=True))
Document The Estimator Method
Quantiles from a finite sample can be interpolated in several valid ways. The default method is linear, but choose another documented method when the domain or a comparison with another tool requires it.
import numpy as np

values = np.array([0, 10, 20, 30])
for method in ["linear", "lower", "higher", "nearest"]:
    print(method, np.quantile(values, 0.25, method=method))
Handle Missing Values Explicitly
quantile can propagate NaN, while nanquantile ignores NaN values. That is a data policy decision, not merely a formatting option; report how missing observations were treated when the result is used for thresholds or monitoring.
import numpy as np

values = np.array([1.0, np.nan, 3.0])
print(np.quantile(values, 0.5))
print(np.nanquantile(values, 0.5))
Use the official NumPy quantile reference for q, axis, method, keepdims, and output behavior. The statistics reference lists nanquantile and related summaries.
For related distribution summaries and missing values, compare NumPy mean(), NumPy standard deviation, and removing NaN values when defining a data-quality policy.
Frequently Asked Questions
What does NumPy quantile() calculate?
It estimates the q-th quantile of an array, where q is a probability between 0 and 1 and the result describes a cut point in the distribution.
What is the difference between quantile() and percentile()?
They express the same idea with different scales: quantile uses q from 0 to 1, while percentile uses values from 0 to 100.
How do I ignore NaN values in a quantile?
Use numpy.nanquantile() when NaN values should be excluded from the calculation rather than propagated.
Why does the method argument matter?
Different estimators interpolate or select sample values differently; choose and document the method when reproducibility or statistical interpretation matters.
