
Quick answer: Raceplotly can create animated bar chart races from tidy time-series data. Prepare a consistent time field, category label, and numeric value, then test ranking, missing categories, frame generation, and the browser or export environment that will display the result.
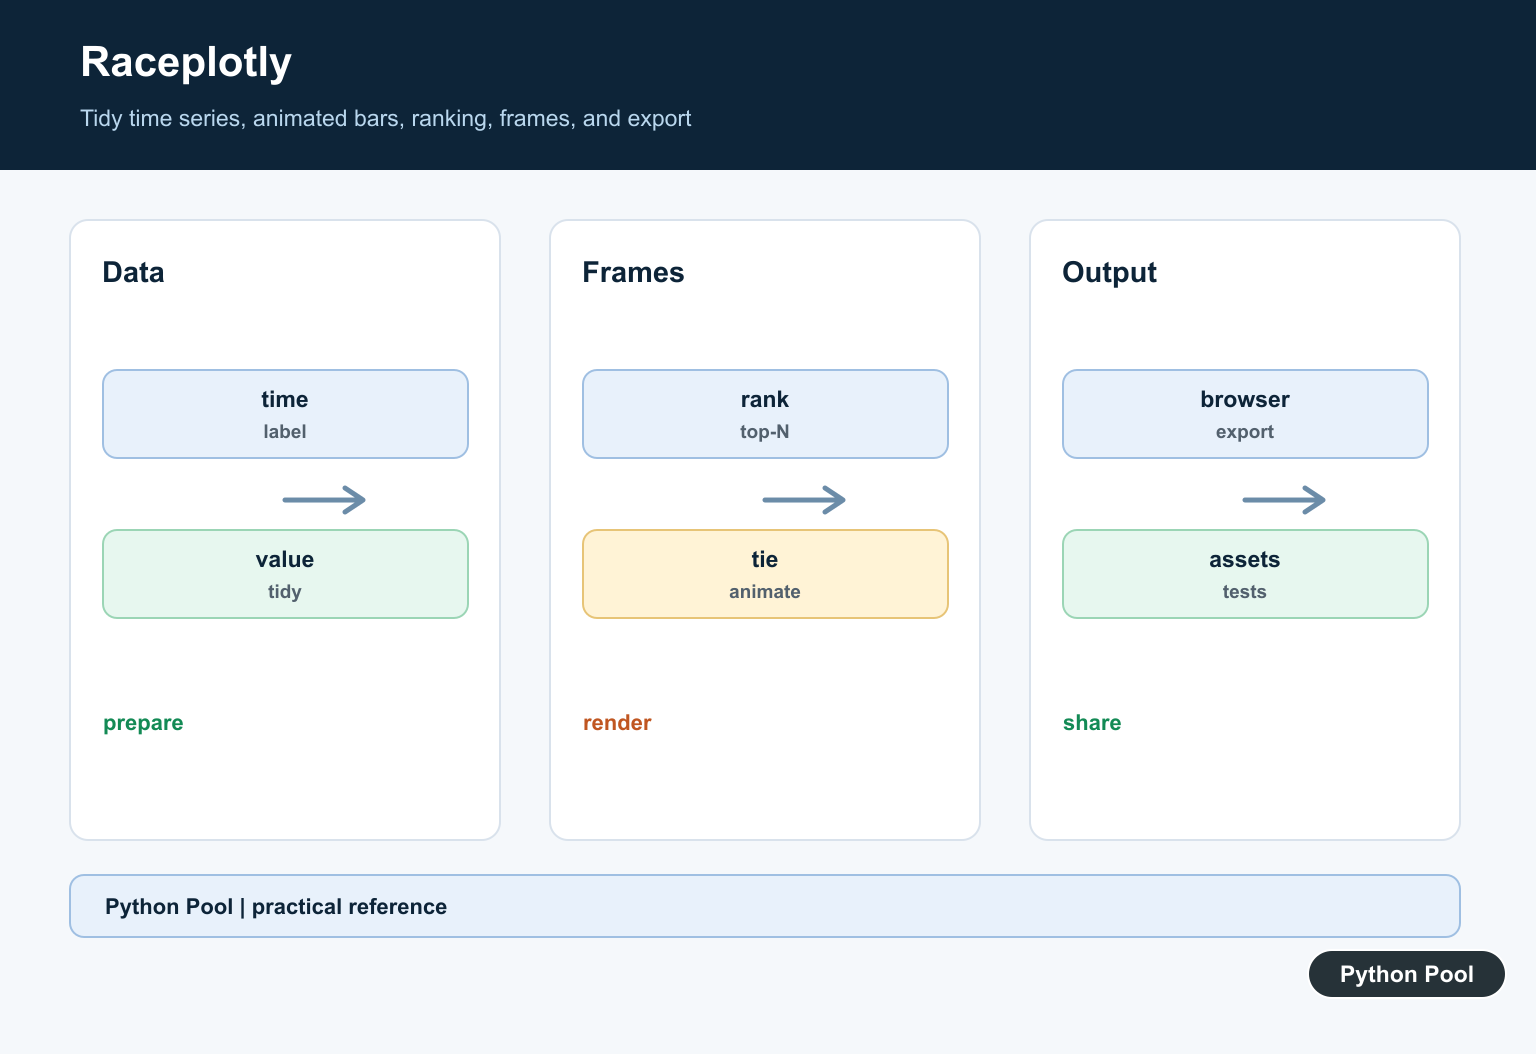
Raceplotly is a small Python package for creating animated bar chart races from a pandas DataFrame. It wraps Plotly so you can rank items over time without building every animation frame by hand. The package is useful when your data already has an item column, a numeric value column, and a time column such as year, month, quarter, or release number.
This guide uses the current package facts carefully. On PyPI, the latest release is 0.1.7, uploaded on November 16, 2022. The project is not a broad dashboard framework; it is a focused helper for bar chart race visuals. For advanced animation, custom controls, or production dashboards, use Plotly, Dash, or Streamlit directly.
When raceplotly is a good fit
Use raceplotly when you want a quick animated ranking chart and your data is already clean. Good examples include top countries by population over time, product sales by quarter, most-used programming languages by year, or team scores across seasons. If you only need a static comparison, a normal bar chart is usually clearer; see the Matplotlib bar chart guide for static bar plots.
The input should be long-form data: one row for each item at each time value. Raceplotly then filters each time step, sorts the rows by value, keeps the top entries, and creates Plotly animation frames.
Install raceplotly
Install raceplotly from PyPI with pip install raceplotly. The package depends on pandas and Plotly. If you manage data in notebooks, keep large outputs under control; PythonPool has a separate guide for fixing the IOPub data rate exceeded issue that can appear with heavy notebook output.
Create a basic bar chart race
The main class is barplot from raceplotly.plots. Pass a DataFrame and name the three required columns: the item to rank, the numeric value, and the time variable. The plot() method returns a Plotly figure, so you can display it in a notebook, write it to HTML, or continue customizing it with Plotly methods.
import pandas as pd
from raceplotly.plots import barplot

data = pd.DataFrame(
    {
        "year": [2021, 2021, 2021, 2022, 2022, 2022, 2023, 2023, 2023],
        "language": ["Python", "JavaScript", "Java", "Python", "JavaScript", "Java", "Python", "JavaScript", "Java"],
        "score": [82, 76, 70, 88, 79, 68, 93, 84, 65],
    }
)

chart = barplot(
    data,
    item_column="language",
    value_column="score",
    time_column="year",
)

fig = chart.plot(
    title="Programming language ranking",
    item_label="Language",
    value_label="Score",
    time_label="Year: ",
    frame_duration=700,
)
fig.show()
The important part is column mapping. Raceplotly does not guess the meaning of each column. If the chart looks empty or incorrectly sorted, first check that the value column is numeric and that every time period has enough rows to rank.
Control top entries and orientation
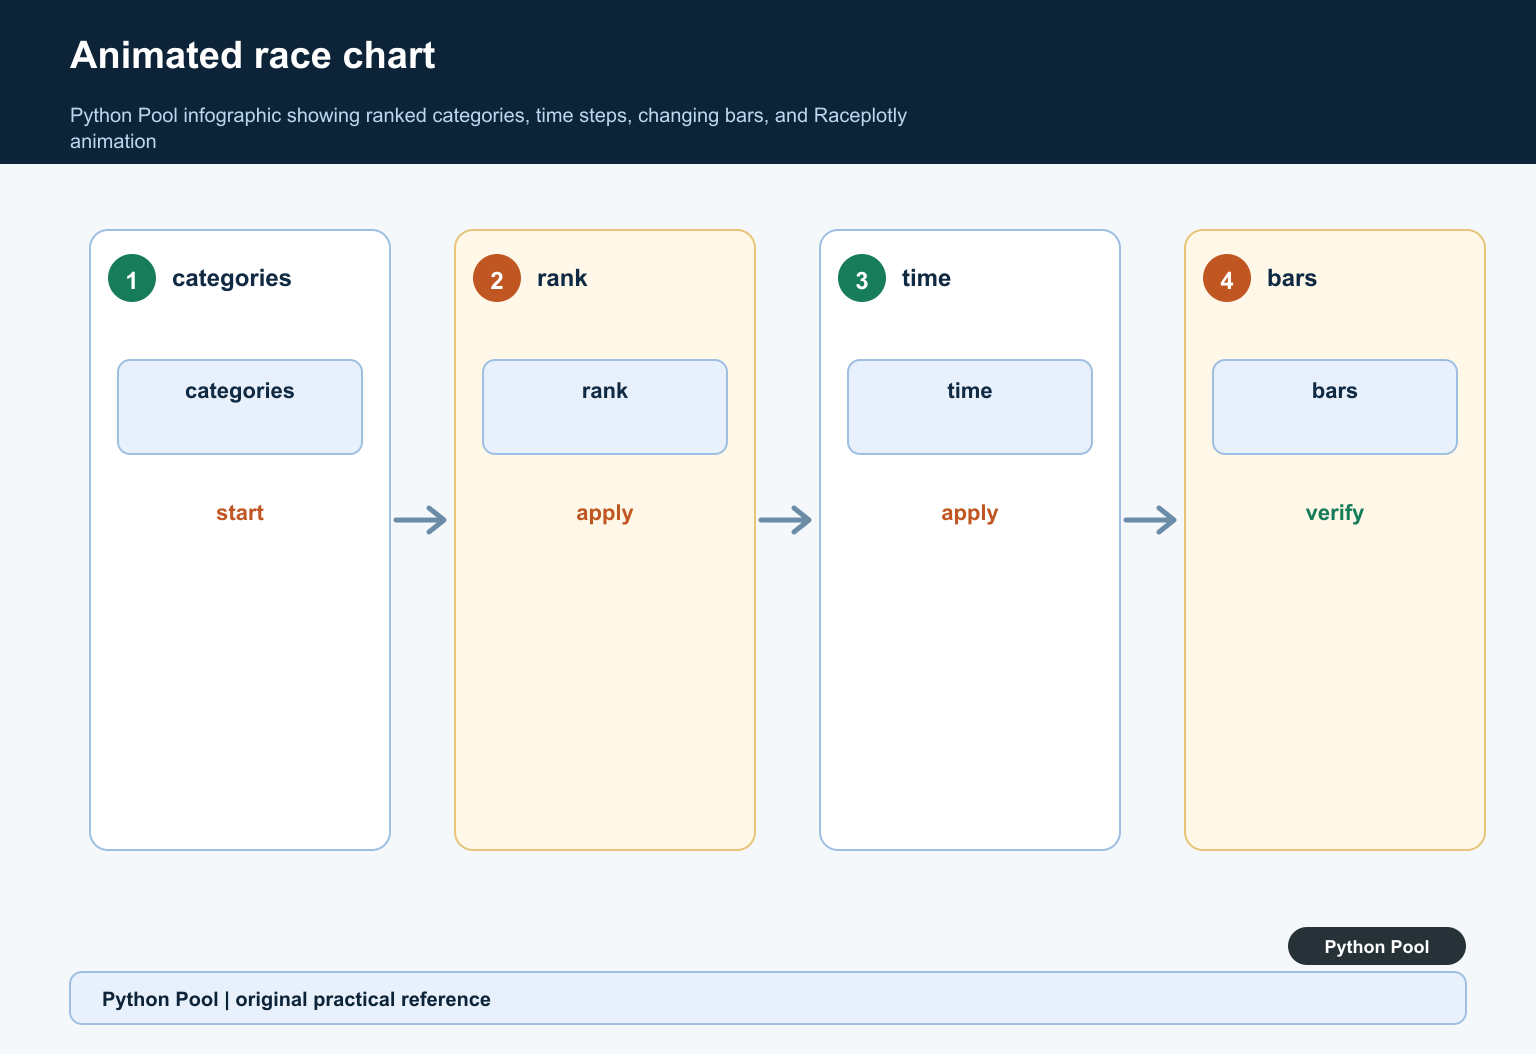
By default, raceplotly keeps the top 10 entries for each time step. Use top_entries when you want fewer bars. A short list is often easier to read, especially on mobile screens or embedded dashboards. You can also choose horizontal or vertical orientation in plot(). Horizontal bars usually work better because item labels have more space.
chart = barplot(
    data,
    item_column="language",
    value_column="score",
    time_column="year",
    top_entries=3,
)

fig = chart.plot(
    orientation="horizontal",
    value_label="Score",
    item_label="Language",
    frame_duration=500,
)
fig.show()
If the chart is part of a broader data workflow, prepare the data first and export intermediate tables when useful. The pandas to_csv guide explains clean CSV output, and the Openpyxl guide covers reading and writing Excel files from Python.
Add stable colors with item_color
Animated ranking charts become confusing when colors change randomly between frames. Use a color column when you need stable brand, category, or item colors. The raceplotly README documents item_color as an optional argument that points to a column containing color values.
colors = {
    "Python": "rgba(37, 99, 235, 1)",
    "JavaScript": "rgba(20, 184, 166, 1)",
    "Java": "rgba(249, 115, 22, 1)",
}

data["color"] = data["language"].map(colors)

chart = barplot(
    data,
    item_column="language",
    value_column="score",
    time_column="year",
    item_color="color",
)

fig = chart.plot(frame_duration=650, time_label="Year: ")
fig.show()
Save a raceplotly chart as HTML
Because plot() returns a Plotly figure, the easiest portable export is an HTML file. This keeps the animation, slider, and play button. Static image exports are not ideal for a chart race because they only capture one frame unless you build a separate video or GIF workflow.
fig = chart.plot(
    title="Language ranking over time",
    value_label="Score",
    item_label="Language",
    time_label="Year: ",
)
fig.write_html("language-ranking-race.html", include_plotlyjs="cdn")
For broader visualization options, compare this with the Python visualizer guide. Raceplotly is best treated as one narrow option inside a larger Python visualization toolkit.
Raceplotly vs Plotly Express
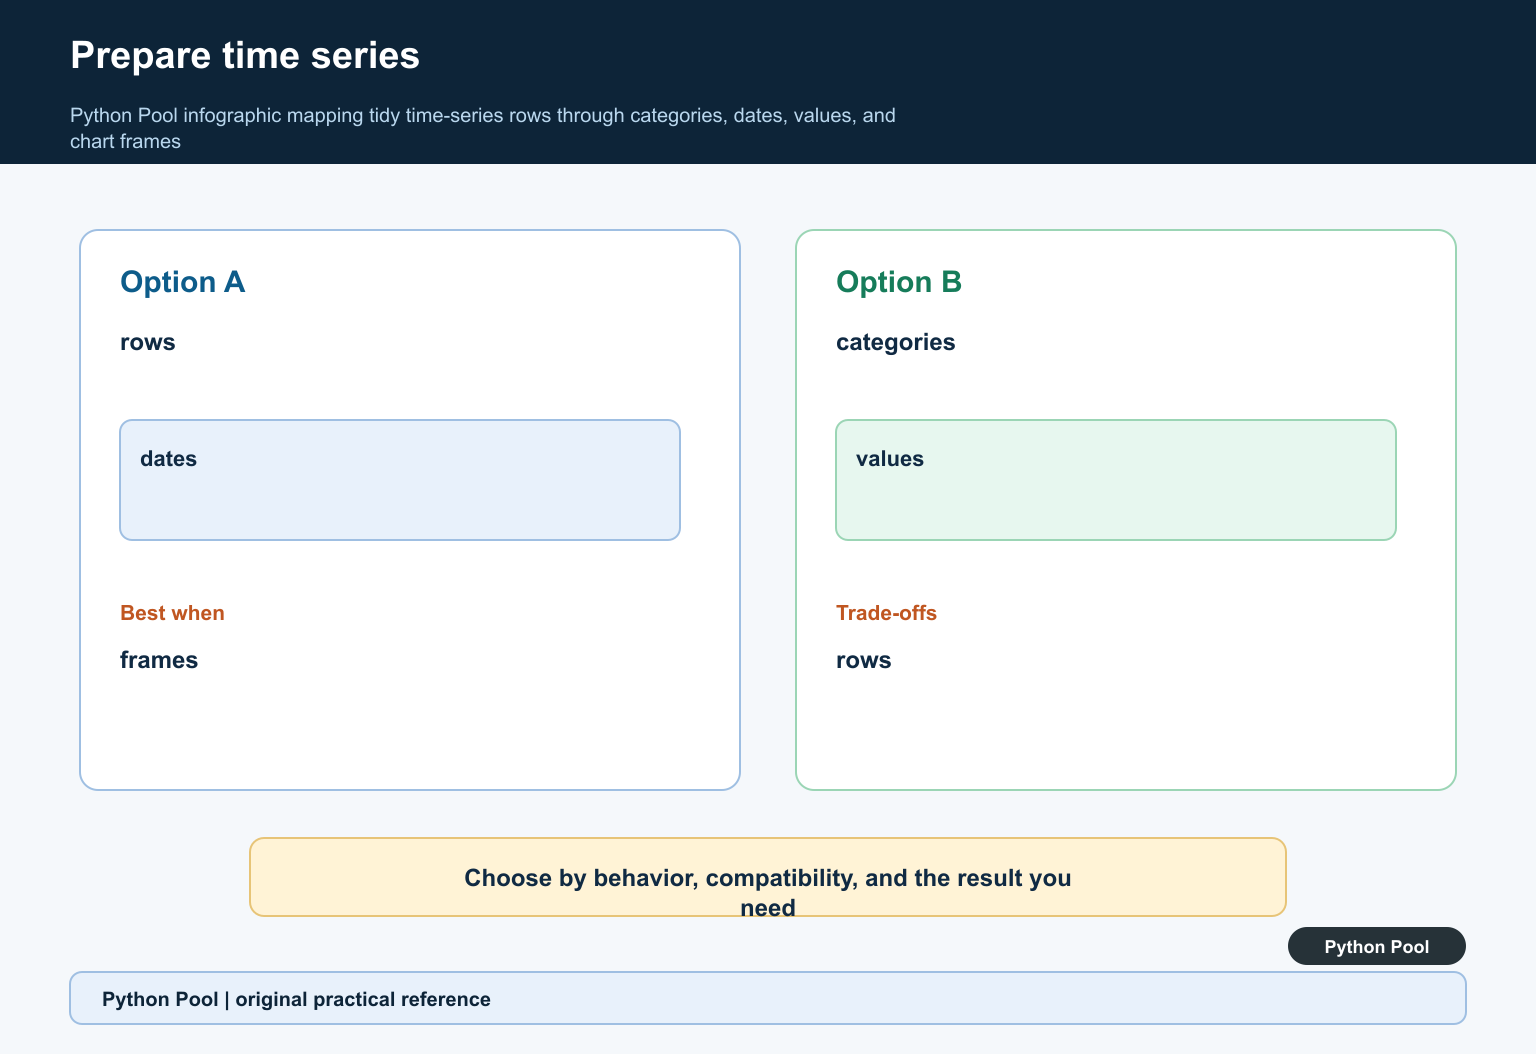
Raceplotly gives you a fast path to one chart type. Plotly Express gives you more control across many chart types, including animated bar charts with animation_frame. If you need custom hover text, facets, color scales, complex callbacks, or multi-chart dashboards, start with Plotly animations, Plotly bar charts, or Dash instead of trying to force raceplotly into a bigger role.
For Streamlit apps, you can create the Plotly figure first and render it with Streamlit’s Plotly chart support. Raceplotly itself is not a Streamlit framework; it only creates the animated figure. Use the Streamlit docs for app layout, inputs, caching, and deployment.
Common raceplotly mistakes
- Wide data instead of long data: convert your data so each row contains one item, one value, and one time period.
- Text values in the value column: clean commas, currency symbols, and percent signs before ranking.
- Too many bars: reduce
top_entriesso labels remain readable. - Unstable colors: add a color column and pass it with
item_color. - Date assumptions: the README notes that date format support was not fully tested, so validate date labels before publishing.
If your DataFrame code uses older pandas patterns, update those before building the chart. For example, pandas removed DataFrame.append(); see the PythonPool fix for DataFrame object has no attribute append.
Official references
- raceplotly on PyPI
- raceplotly GitHub repository
- pandas DataFrame reference
- plotly.express.bar reference
- Dash documentation
Prepare Tidy Records
Keep one observation per time and category, use consistent labels, and convert numeric values before passing them to the chart layer. Duplicate rows at one time can make ranking ambiguous.
Define The Time Field
Time may be dates, years, or ordered periods. Sort it, choose the frame frequency, and handle missing periods explicitly instead of letting string ordering or null values decide the animation.
Control Top-N And Ties
A bar race often displays only the leading categories. Define how ties are handled, whether categories can enter or leave the top set, and whether color assignments remain stable across frames.
Keep Labels Readable
Shorten or wrap long names carefully, choose a stable color mapping, and avoid overlays that hide values. An animation should still communicate the ranking without requiring the viewer to pause every frame.
Test Rendering And Export
Interactive Plotly output may depend on a browser, notebook, or renderer. Test the actual deployment path and file format, including fonts, frame speed, and whether audio or embedded assets are involved.
Validate With Small Data
Use a tiny known dataset with one leader change, a missing category, a tie, and a new entrant. Confirm that frame order and displayed values match the source before scaling up.
Use the current official Plotly Python documentation and the Raceplotly package documentation for version-specific APIs. Related Python Pool references include testing and logging.
For related visualization workflows, compare data-shape tests, render diagnostics, and array preparation before animating rankings.
Frequently Asked Questions
What is Raceplotly used for?
Raceplotly helps create animated bar chart race visualizations from time-series category data in Python.
What shape should Raceplotly data have?
Use tidy records with a time field, category or label field, and numeric value field, then confirm the package’s current column requirements.
Why do animated bars show missing categories?
Categories may be absent in a time frame, filtered by a top-n setting, or represented inconsistently across rows.
How should I export a Raceplotly chart?
Test the interactive output and choose an export path supported by the current Plotly and rendering environment, including any browser or video dependencies.
