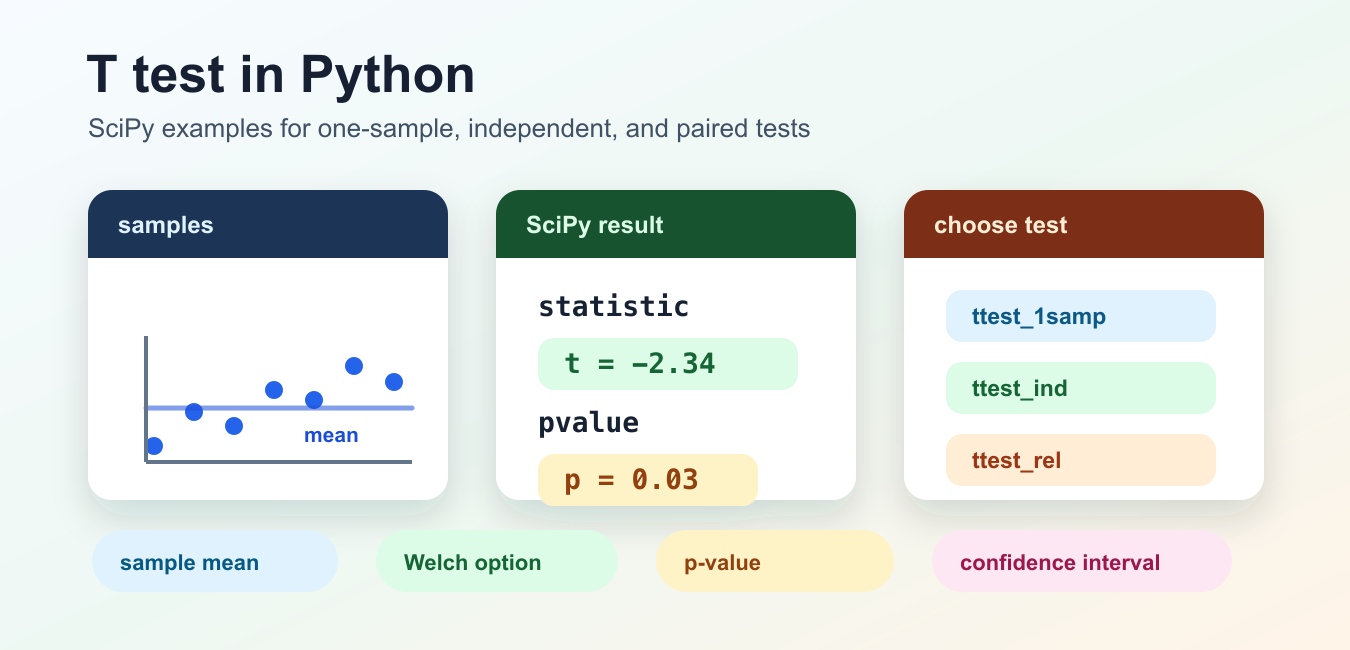
Quick answer: Choose a SciPy t-test from the study design: ttest_1samp compares a sample with a reference value, ttest_ind compares independent groups, and ttest_rel compares paired observations. Report the estimate, confidence interval or effect size, assumptions, and p-value together.
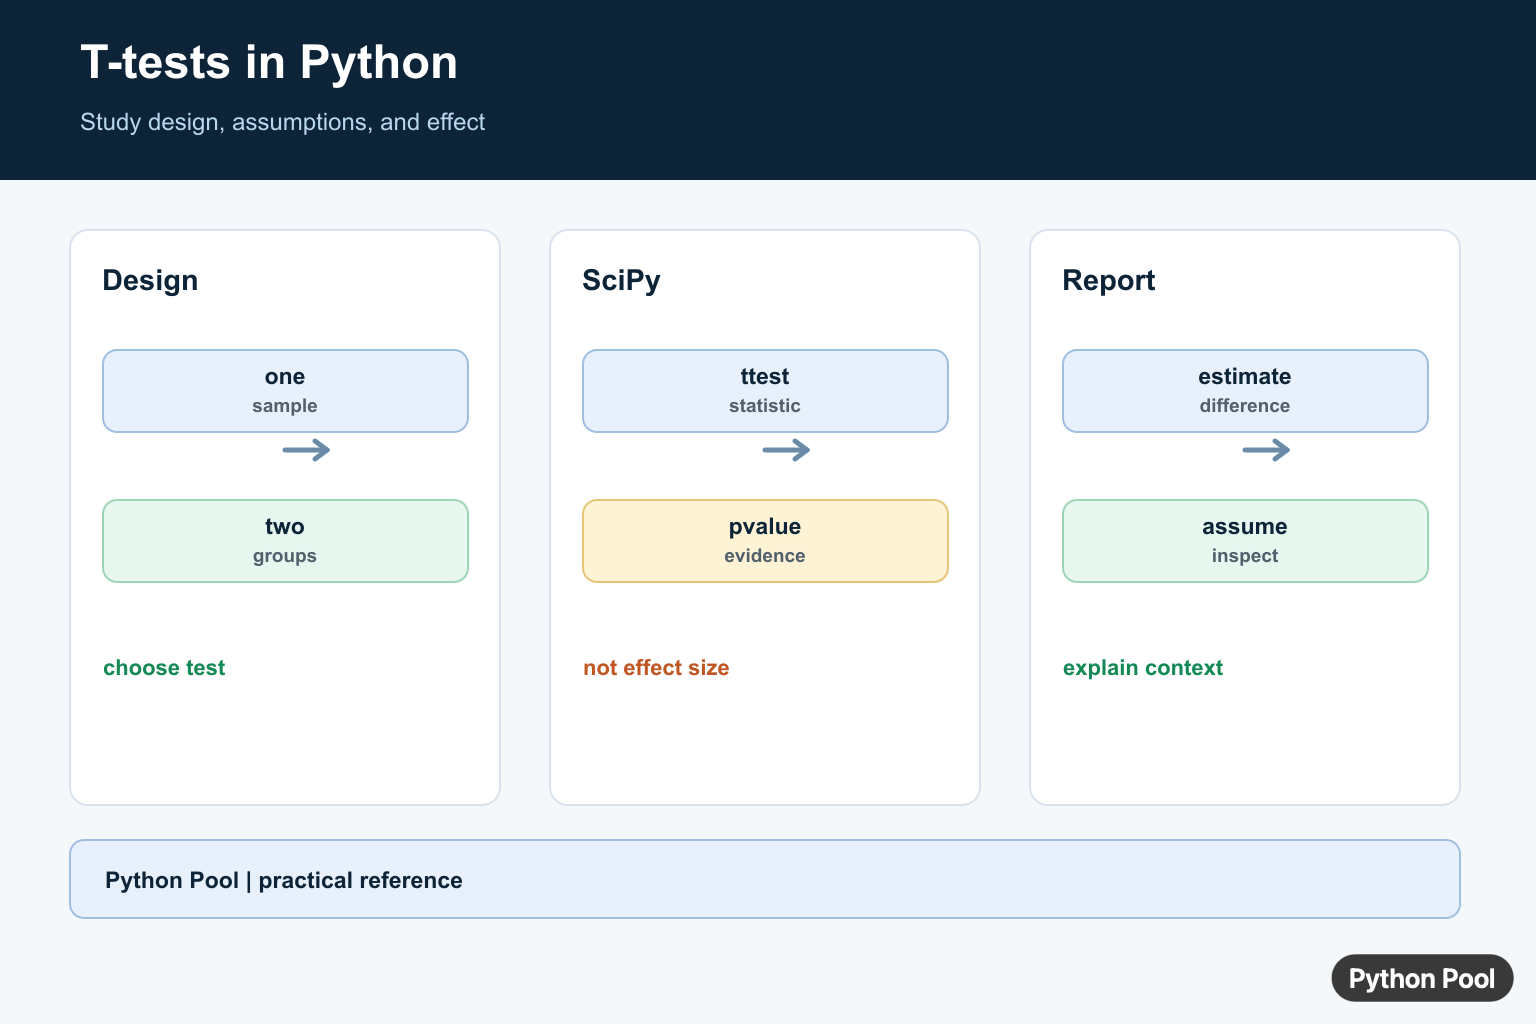
A t test in Python compares sample means and returns a test statistic plus a p-value. In SciPy, the common functions are scipy.stats.ttest_1samp, scipy.stats.ttest_ind, and scipy.stats.ttest_rel. Choose the function from the study design before looking at the result.
Use a one-sample test when one group is compared with a known population mean. Use an independent two-sample test when two separate groups are compared. Use a paired test when each observation in one group is naturally matched with an observation in the other group, such as before-and-after measurements from the same subjects.
The null hypothesis usually says the means are equal, or that the sample mean equals a target value. A small p-value does not measure effect size. It only says the observed result would be unusual under the null hypothesis and the assumptions of the chosen test.
Before running a t test, check that the data source, grouping, and missing-value rules are clear. The function call is short, but the interpretation depends on whether the samples are independent, paired, or compared with a fixed target.
Also decide the significance threshold before running the analysis. Many tutorials use 0.05, but the right threshold depends on the cost of false positives, the study plan, and whether you are testing many comparisons.
Check SciPy Version
Start by checking the installed SciPy release. Recent SciPy t-test result objects expose fields such as statistic, pvalue, and df, and some functions include a confidence interval method.
from importlib.metadata import version

print(version("scipy"))
If this fails, install SciPy in the active environment and restart the interpreter or notebook. Version checks also make examples easier to reproduce later.
One-Sample T Test
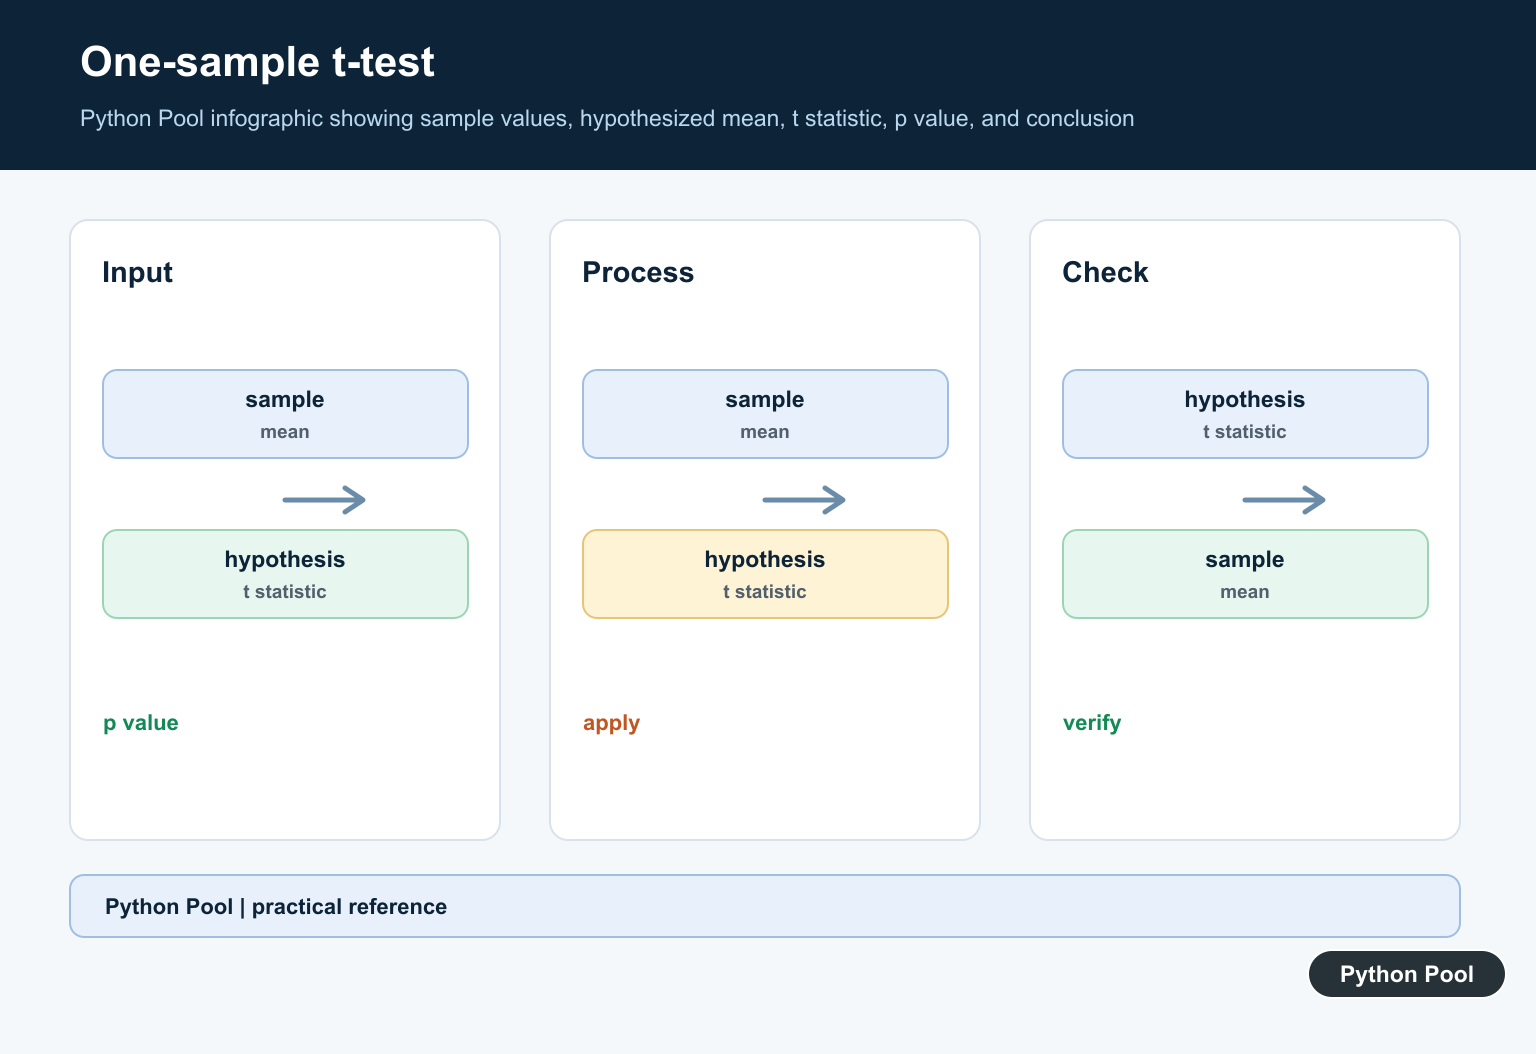
Use ttest_1samp when you want to compare one sample mean with a target mean. The SciPy documentation describes this as a test for whether the expected value of independent observations equals popmean.
import numpy as np
from scipy import stats

scores = np.array([81, 84, 79, 88, 85, 90, 83, 86])
result = stats.ttest_1samp(scores, popmean=80)

print(result.statistic)
print(result.pvalue)
print(result.df)
If pvalue is below your chosen threshold, you have evidence against the target-mean null hypothesis. If it is not below the threshold, do not claim the means are equal; say that this sample did not provide enough evidence to reject the null hypothesis.
For related mean and spread calculations, see the NumPy mean guide. Keeping the descriptive statistics next to the t test makes the result easier to review.
Independent Two-Sample T Test
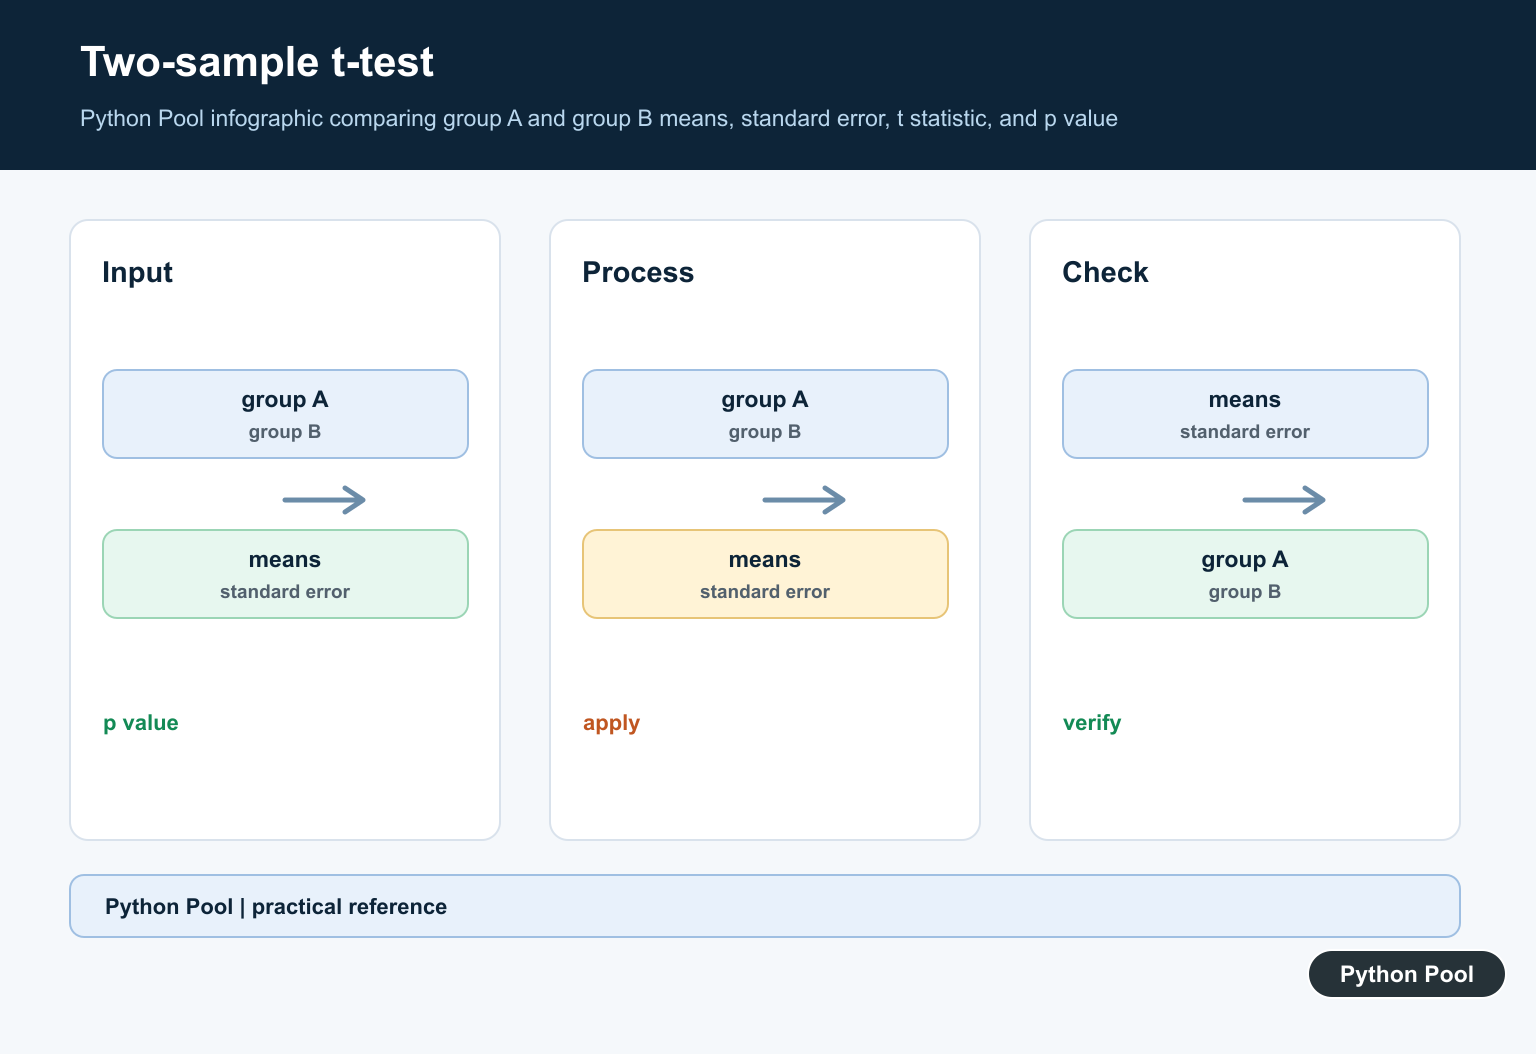
Use ttest_ind for two separate groups. In many real projects, set equal_var=False so SciPy runs Welch’s t test, which does not assume equal population variance.
import numpy as np
from scipy import stats

control = np.array([71, 74, 76, 73, 75, 72])
treatment = np.array([78, 80, 77, 82, 79, 81])

result = stats.ttest_ind(control, treatment, equal_var=False)
print(result.statistic)
print(result.pvalue)
The groups should represent independent observations. Do not use this test for before-and-after data from the same subjects, because that pairing carries useful information that an independent test ignores.
Welch’s test is a practical default when group spreads differ or sample sizes are not the same. If you have a strong reason to assume equal variance, document it beside the code.
Paired T Test
Use ttest_rel when observations are matched in pairs. The function tests whether the mean difference between paired values is zero.
import numpy as np
from scipy import stats

before = np.array([62, 65, 64, 68, 70, 66])
after = np.array([66, 67, 68, 72, 73, 70])

result = stats.ttest_rel(before, after)
print(result.statistic)
print(result.pvalue)
Both arrays must describe the same units in the same order. If the first entry in before belongs to one subject, the first entry in after must belong to that same subject.
Alternative Hypotheses And Missing Values
SciPy t-test functions accept alternative for two-sided or one-sided tests. They also accept nan_policy so you can decide whether missing values should propagate, be omitted, or raise an error.
import numpy as np
from scipy import stats

sample = np.array([5.1, 5.4, np.nan, 5.8, 5.6])

result = stats.ttest_1samp(
    sample,
    popmean=5.0,
    alternative="greater",
    nan_policy="omit",
)

print(result.pvalue)
Choose one-sided alternatives before seeing the result. Switching from two-sided to one-sided after checking the p-value makes the analysis unreliable.
Confidence Interval From A Result
Some SciPy t-test result objects provide confidence_interval(). This is useful because it reports a range for the mean or mean difference, not just a threshold decision.
import numpy as np
from scipy import stats

scores = np.array([81, 84, 79, 88, 85, 90, 83, 86])
result = stats.ttest_1samp(scores, popmean=80)
interval = result.confidence_interval(confidence_level=0.95)

print(interval.low)
print(interval.high)
Report the test type, statistic, p-value, degrees of freedom, confidence interval, and a plain-language interpretation. For array preparation before statistical tests, the NumPy reshape guide can help keep sample dimensions predictable.
The most reliable workflow is simple: choose the test from the design, inspect the data, run the matching SciPy function, then explain what the p-value does and does not prove. That keeps the statistical conclusion tied to the actual question.
If the samples are very small, heavily skewed, or full of outliers, treat the t-test result as one piece of evidence rather than the whole analysis. Plot the data and consider a nonparametric or resampling method when the assumptions are weak.
Run A One-Sample Test
A one-sample t-test asks whether a sample mean is compatible with a specified population mean under the model assumptions. The test statistic and p-value do not replace an estimate or a practical effect interpretation.
import numpy as np
from scipy import stats

sample = np.array([10.2, 9.8, 10.4, 10.1, 9.9])
result = stats.ttest_1samp(sample, popmean=10.0)
print(result.statistic, result.pvalue)
Compare Independent Groups
Use ttest_ind for two groups that represent separate observations. Welch’s variant, equal_var=False, is a safer default when group variances or sample sizes differ materially.
import numpy as np
from scipy import stats

control = np.array([4.1, 4.3, 4.0, 4.2])
treatment = np.array([4.7, 4.5, 4.8, 4.6])
result = stats.ttest_ind(control, treatment, equal_var=False)
print(result.statistic, result.pvalue)
Use Paired Observations
When each value in one sample is naturally matched with one value in another, ttest_rel analyzes within-pair differences. Do not use an independent test merely because the data arrived in two columns.
import numpy as np
from scipy import stats

before = np.array([12, 10, 11, 13])
after = np.array([10, 9, 10, 11])
result = stats.ttest_rel(before, after)
print(result.statistic, result.pvalue)
Interpret Results Carefully
A p-value is computed under a null model and assumptions; it is not the probability that the null is true. Inspect distributions and outliers, consider Welch or a nonparametric method, and report an effect size and uncertainty when the decision matters.
import numpy as np
from scipy import stats

group_a = np.array([2.1, 2.2, 2.0, 2.3, 2.1])
group_b = np.array([2.4, 2.5, 2.3, 2.6, 2.4])
result = stats.ttest_ind(group_a, group_b, equal_var=False)
print({"difference": group_b.mean() - group_a.mean(), "pvalue": result.pvalue})
SciPy’s official statistics documentation lists one-sample, independent, paired, and Welch-style tests. Choose the test from the data-generating design, not only from the shape of the input array.
For related numerical analysis, compare SciPy solvers, standard deviation, and averages in Python when the test result needs a broader estimate and uncertainty discussion.
Frequently Asked Questions
How do I perform a t-test in Python?
Use the appropriate scipy.stats function such as ttest_1samp, ttest_ind, or ttest_rel after defining the study design.
What is the difference between one-sample and two-sample t-tests?
A one-sample test compares a sample mean with a reference value, while a two-sample test compares observations from two groups.
How should I interpret a t-test p-value?
A p-value measures compatibility with the null model under its assumptions; it is not the probability that the null hypothesis is true or a measure of effect size.
What if the assumptions of a t-test are poor?
Inspect the data and study design, consider Welch’s test or a nonparametric alternative, and report the choice rather than relying on a blind threshold.
