Quick Answer
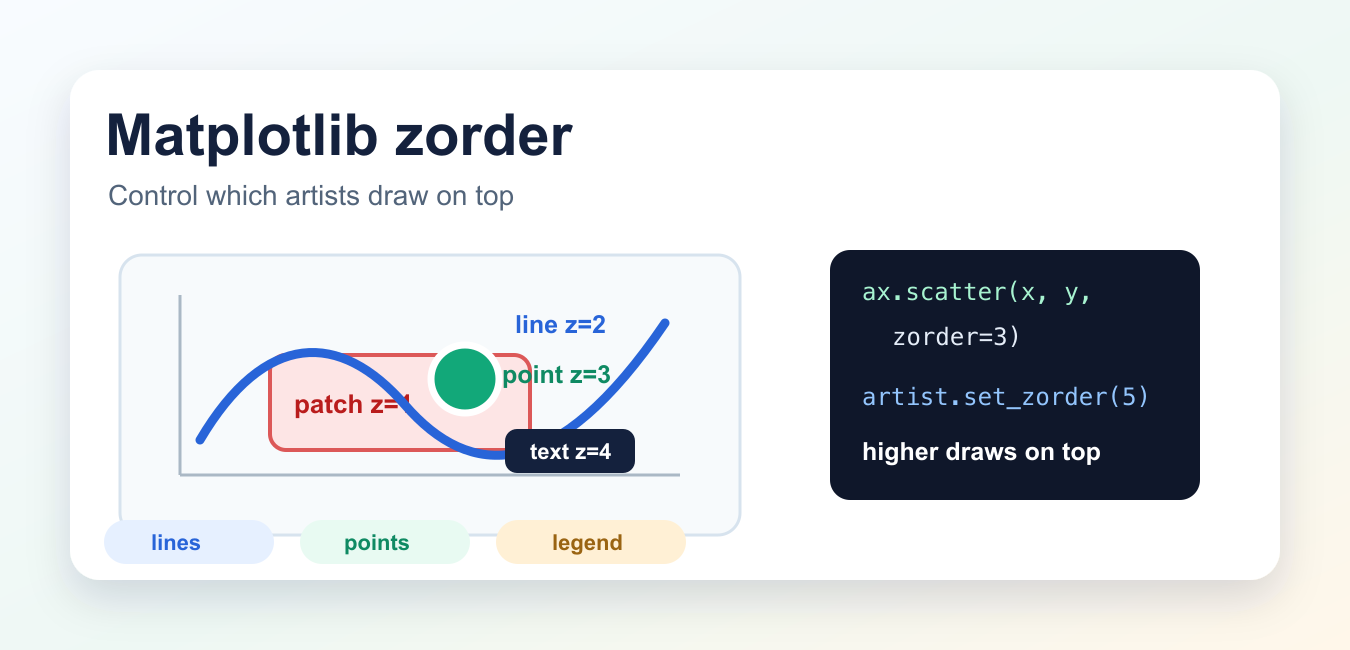
Set an artist’s zorder to control its drawing layer in a Matplotlib Axes. Higher values are drawn later and usually appear on top: for example, put a patch at 1, a line at 2, text at 3, and a legend at 5. Apply the setting to the specific artist or use axis-level grid controls when appropriate.
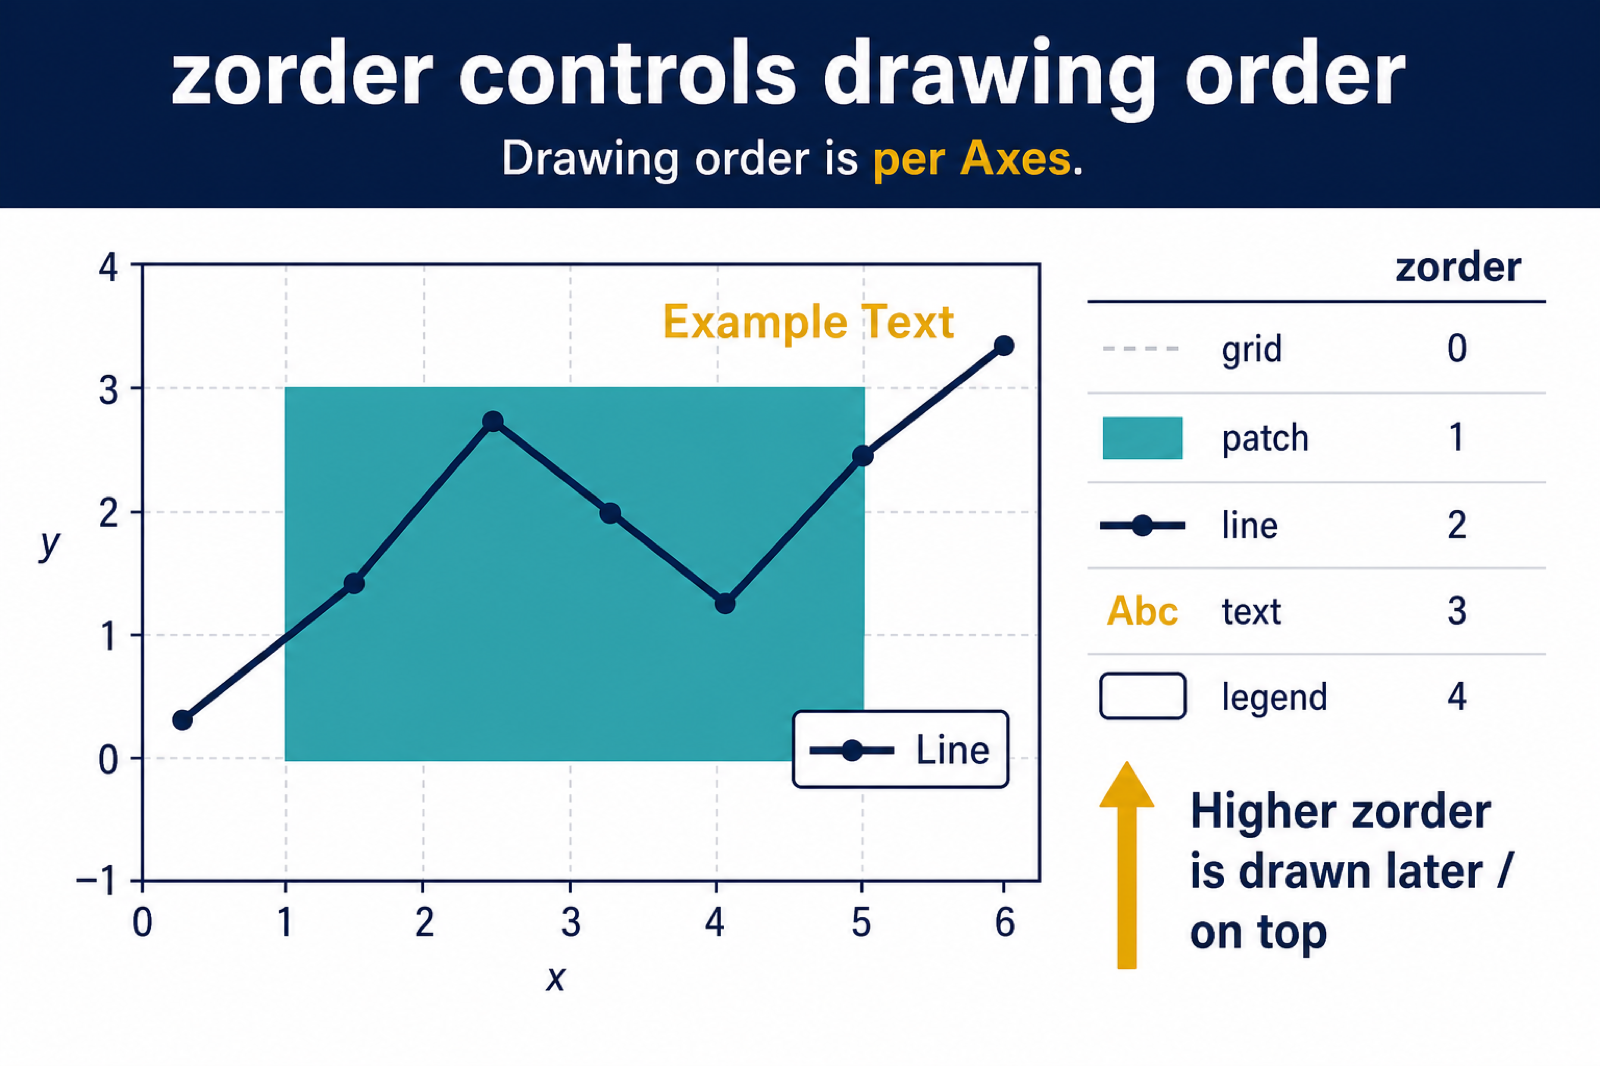
zorder controls the drawing order of Matplotlib artists. Artists with lower zorder values are drawn first, and artists with higher zorder values are drawn later, so they appear on top.
Use zorder when a line hides points, a grid covers a plot, text appears behind a patch, or a legend needs to sit above the chart.
What zorder Means in Matplotlib
Every visible object in a Matplotlib figure is an artist: lines, markers, patches, text, images, ticks, grid lines, and legends. Each artist has a numeric zorder. Larger numbers are closer to the front of the drawing stack.
Matplotlib has default zorder values for common artist types. The official zorder demo lists images at 0, patches at 1, lines and line collections at 2, text at 3, and legends at 5. You can override these defaults for individual artists.
Basic zorder Example
import numpy as np
import matplotlib.pyplot as plt

x = np.linspace(0, 10, 100)
y = np.sin(x)

fig, ax = plt.subplots()

ax.scatter(x, y, s=80, color="seagreen", zorder=3)
ax.plot(x, y, color="navy", linewidth=4, zorder=2)

plt.show()
Here, the scatter points use zorder=3 and the line uses zorder=2, so the points are drawn on top of the line.
Set zorder After Creating an Artist
You can pass zorder when creating an artist, or change it later with set_zorder().
line, = ax.plot(x, y, linewidth=4)
points = ax.scatter(x, y, s=80)

line.set_zorder(2)
points.set_zorder(3)
Use get_zorder() when you need to inspect the current value:
print(points.get_zorder())Put Grid Lines Behind Data
If grid lines compete with your data, lower their drawing priority with set_axisbelow() or by styling the grid lightly.
fig, ax = plt.subplots()
ax.set_axisbelow(True)
ax.grid(True, color="0.85", linewidth=1)
ax.plot(x, y, linewidth=3, zorder=3)
Matplotlib also has axes.axisbelow settings for grid and tick ordering. For many plots, ax.set_axisbelow(True) is the simplest fix.
zorder With Patches, Text, and Annotations
Layering matters when patches and labels overlap the data. Give background regions low zorder values and text or annotations higher values.
ax.axvspan(2, 4, color="gold", alpha=0.25, zorder=1)
ax.plot(x, y, color="navy", zorder=2)
ax.annotate(
    "highlight",
    xy=(3, np.sin(3)),
    xytext=(20, 30),
    textcoords="offset points",
    arrowprops={"arrowstyle": "->"},
    zorder=4,
)
For more label examples, see the Matplotlib annotate guide. For reference markers that often need zorder tuning, see Matplotlib vertical lines.
Bring a Legend to the Front
Legends usually have a high default zorder, but you can still control them explicitly.
legend = ax.legend()
legend.set_zorder(10)
This is useful when a dense plot or transparent artist overlaps the legend.
Important Caveat: Overlapping Axes
Matplotlib draws one Axes at a time. If two Axes overlap, all artists in the later Axes can appear above artists in the earlier Axes, regardless of individual zorder values. In that case, adjust the Axes order, transparency, or layout instead of relying only on artist zorder.
Common Mistakes
- Using zorder to fix the wrong Axes. In multi-Axes figures, call plotting methods on the intended
ax. The Matplotlib gca guide explains current Axes behavior. - Forgetting default values. Lines already draw above patches by default, while legends usually draw above both.
- Making every object high zorder. Use clear relative values such as
1,2,3, and10. - Covering data with opaque patches. Combine low zorder with
alphafor highlight regions.
Related Matplotlib Guides
Zorder often matters when plots include shapes, markers, and image-like layers. See how to draw circles in Matplotlib, Matplotlib arrows, Matplotlib pcolormesh, Matplotlib background color, and Matplotlib tight_layout.
Official References
- Matplotlib zorder demo
- Matplotlib Artist.set_zorder documentation
- Matplotlib Artist.get_zorder documentation
Conclusion
zorder is Matplotlib’s layer control. Lower values draw first, higher values draw on top. Set it directly in plotting calls or adjust an existing artist with set_zorder(), and remember that overlapping Axes have their own draw order.
Set zorder When Creating Artists
Pass zorder to plotting calls or call artist.set_zorder() afterward. This is useful when a filled region hides a line or when annotations need to remain readable.
import matplotlib.pyplot as plt

fig, ax = plt.subplots()
ax.fill_between([0, 1, 2], [1, 2, 1], alpha=0.35, zorder=1)
ax.plot([0, 1, 2], [1, 2, 1], color="black", zorder=3)
ax.text(1, 2.1, "peak", zorder=4)
ax.set_axisbelow(True)
plt.show()
Use the smallest clear ordering scheme. Very large arbitrary values make a plot harder to maintain and do not solve artists that belong to different axes.
Remember That zorder Is Per Axes
Matplotlib draws each Axes as its own plotting area. An artist with a high zorder in one axes does not automatically cover an artist in another axes; the axes themselves may need an explicit position or zorder.
legend = ax.legend()
legend.set_zorder(10)

for grid_line in ax.get_xgridlines() + ax.get_ygridlines():
    grid_line.set_zorder(0)
Inspect the exact artist that is hidden, then set its zorder and transparency deliberately. A clipped artist, an opaque patch, or a second axes can look like a zorder problem even when the draw order is correct.
Frequently Asked Questions
What does zorder do in Matplotlib?
It controls the drawing order of artists in an Axes. Higher zorder values are normally drawn later and appear above lower values.
How do I put a line in front of a Matplotlib patch?
Give the line a higher zorder than the patch, for example patch zorder=1 and line zorder=3.
How do I move a legend to the front?
Keep the legend object returned by ax.legend() and call legend.set_zorder() with a value above the artists it should cover.
Why does zorder not fix my overlapping Matplotlib axes?
zorder is applied within an Axes. Multiple axes, clipping, transparency, and axes placement can also determine which content is visible.

Hello, very good.
What is the meaning of letter ‘z’ in the zorder parameter?
The letter z demonstrates the order along the z-axis. The matplotlib has default x and y-axis. Suppose there is a condition where you have to make one graph closer to the observer than the other (above the other graph), here, you can use zorder to move it along the z-axis.
This method is widely used in CSS and is known as ‘z-index’ there. Have a look at it if you want to know more about more details.
Regards,
Pratik