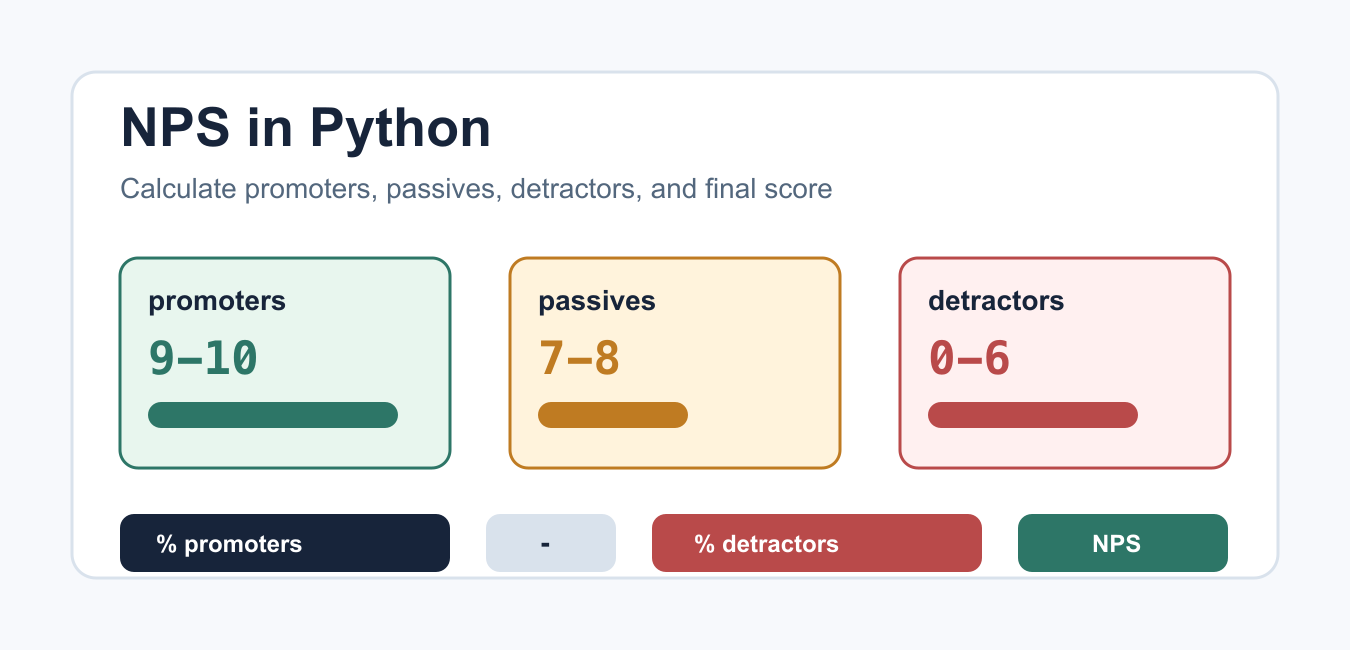
Quick answer: Net Promoter Score is the percentage of promoters scoring 9 or 10 minus the percentage of detractors scoring 0 through 6. Passives scoring 7 or 8 remain in the valid-response denominator, and invalid or missing answers need an explicit exclusion rule.
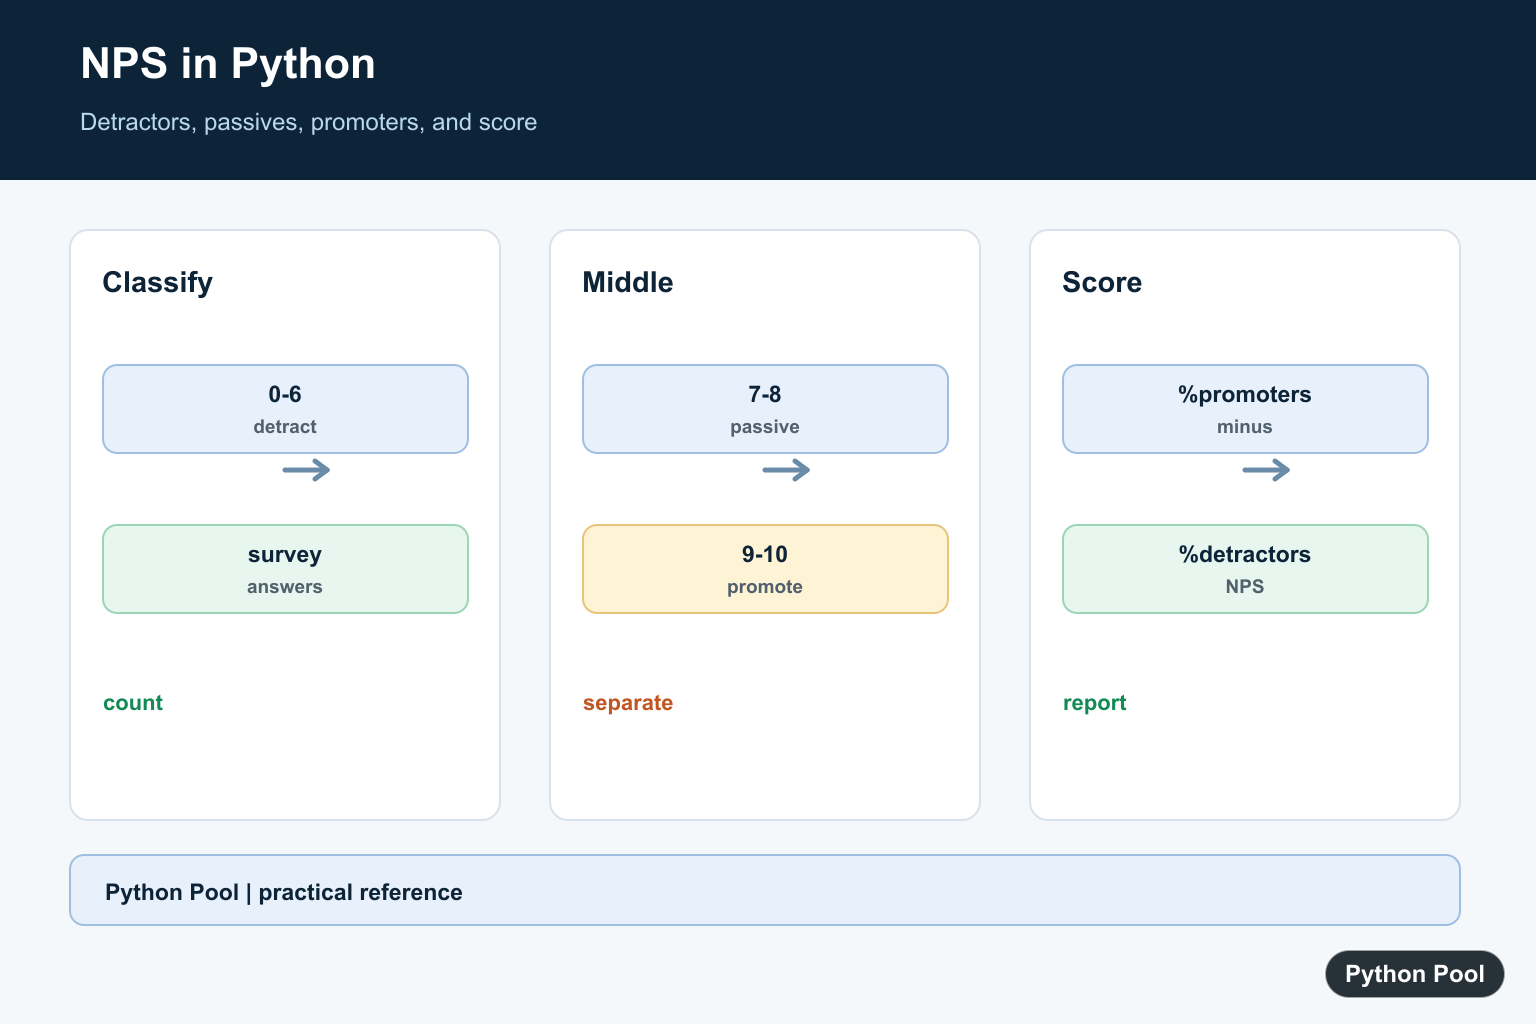
Net Promoter Score, usually shortened to NPS, is a customer loyalty metric based on a 0-to-10 recommendation question. In Python, the calculation is straightforward: classify each score, count the groups, convert counts to percentages, and subtract the detractor percentage from the promoter percentage.
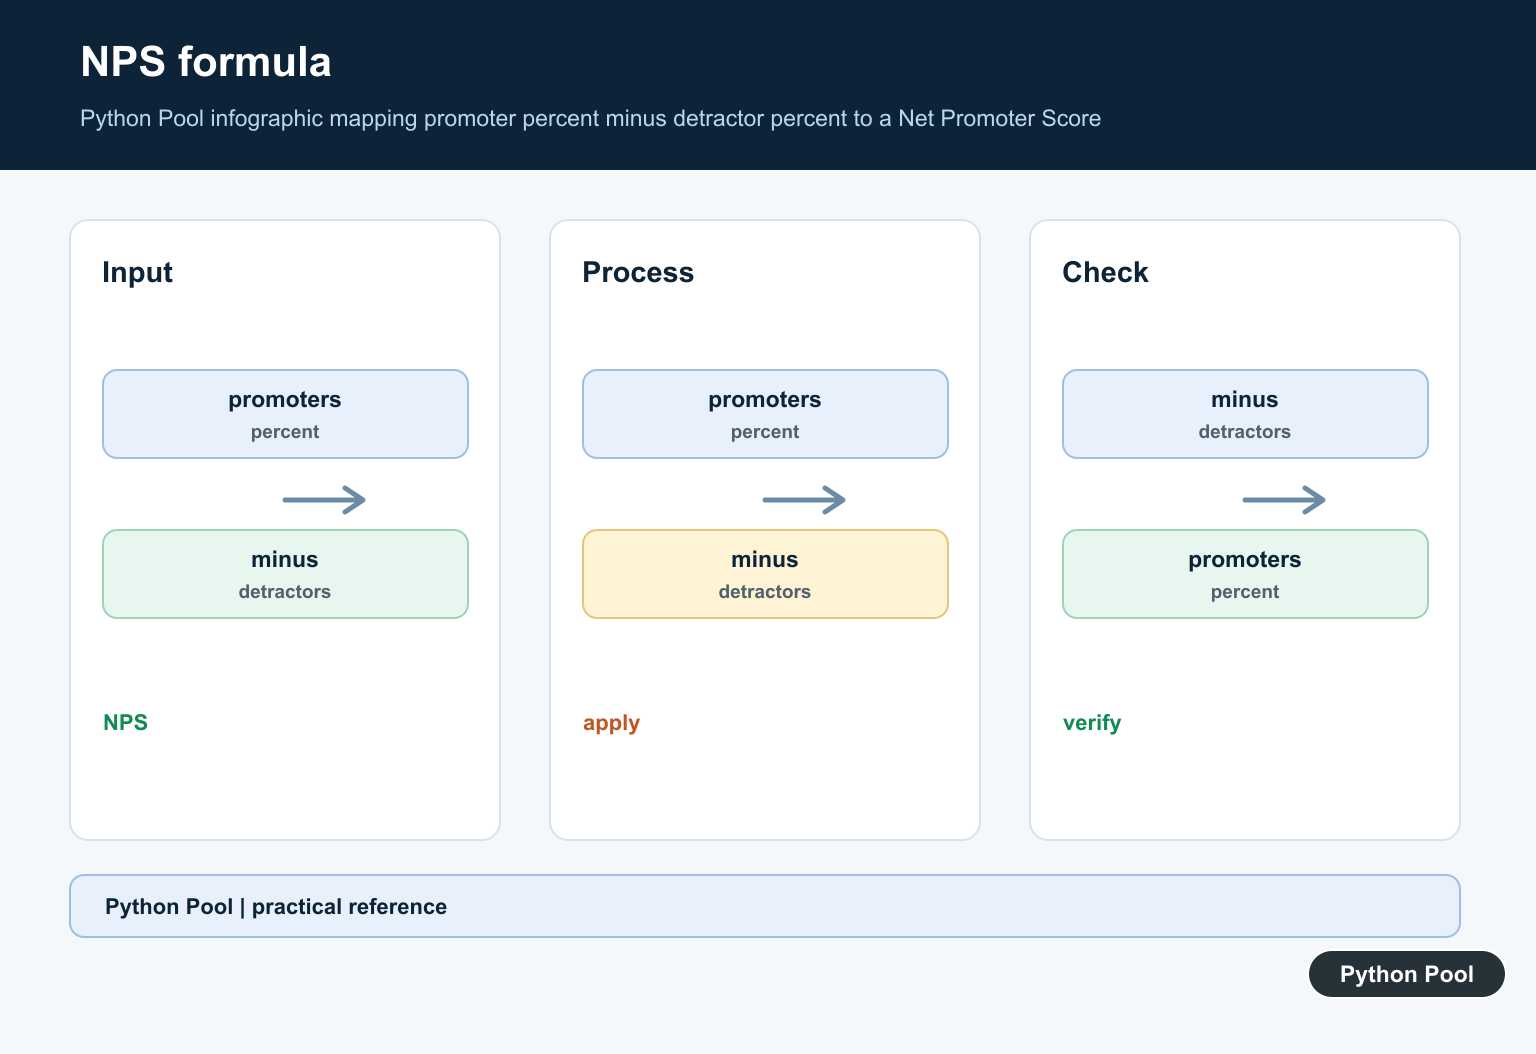
The Net Promoter System scoring guide defines promoters as scores 9-10, passives as scores 7-8, and detractors as scores 0-6. The formula is NPS = % promoters - % detractors. Passives are not subtracted, but they still count in the total response count, so they lower the possible promoter and detractor percentages.
NPS is not an average rating. A group with many middle scores can have a lower NPS than a group with fewer total responses but more promoters. That is why the classification step matters. Python makes the calculation repeatable, so you can run it on fresh survey exports, segment it by product or region, and produce the same metric every time.
Classify NPS responses
Start with a small function that turns each numeric survey response into a group. Keeping this logic in one function makes later calculations easier to read and test.
def classify_nps(score):
    if score >= 9:
        return "promoter"
    if score >= 7:
        return "passive"
    return "detractor"

print(classify_nps(10))
print(classify_nps(8))
print(classify_nps(4))
This function assumes scores are already valid numbers from 0 through 10. In production code, validate the survey data before calculating the score. Bad values should be fixed, excluded, or reported instead of silently mixed into the metric.
Calculate NPS from a Python list
For a list of responses, count promoters and detractors, divide by the total number of responses, and multiply by 100. The result can range from -100 to 100.
scores = [10, 9, 8, 7, 6, 10, 5, 9, 8, 4]

total = len(scores)
promoters = sum(1 for score in scores if score >= 9)
detractors = sum(1 for score in scores if score <= 6)
nps = ((promoters - detractors) / total) * 100

print(round(nps))
This example returns a whole-number score with round(). If you need a decimal for dashboards or QA checks, keep one or two decimal places. For related list math, see Python average of list.
Validate scores before calculating
Real survey exports can contain blanks, text, or values outside the 0-to-10 range. A defensive function should filter or reject invalid entries and handle an empty result clearly.
def calculate_nps(scores):
    valid_scores = [score for score in scores if isinstance(score, int) and 0 <= score <= 10]
    if not valid_scores:
        return None

    total = len(valid_scores)
    promoters = sum(1 for score in valid_scores if score >= 9)
    detractors = sum(1 for score in valid_scores if score <= 6)
    return round(((promoters - detractors) / total) * 100)

print(calculate_nps([10, 9, 7, 4, 11, "bad"]))
Returning None for no valid data is usually better than returning zero, because zero is a valid NPS result. That distinction helps downstream code avoid confusing missing data with a balanced score.
Count promoters, passives, and detractors
The final NPS score is useful, but the group distribution explains why the score moved. Python’s collections.Counter is a clean way to count each group.
from collections import Counter

def classify_nps(score):
    if score >= 9:
        return "promoter"
    if score >= 7:
        return "passive"
    return "detractor"

scores = [10, 9, 8, 7, 6, 10, 5, 9, 8, 4]
groups = Counter(classify_nps(score) for score in scores)
print(groups)
Group counts are helpful for reports because two teams can have the same NPS but very different response distributions. A team with many passives may need a different action plan than a team split between strong promoters and unhappy detractors.
Always show the response count beside the group counts. A high score from a tiny sample is less reliable than a stable score from a larger sample. This is especially important when comparing teams, products, campaigns, or date ranges.
Calculate NPS by segment with pandas
If your survey data includes segments, products, regions, or dates, calculate NPS by group. The same formula works inside a pandas groupby().
import pandas as pd

def nps_from_series(scores):
    total = len(scores)
    promoters = (scores >= 9).sum()
    detractors = (scores <= 6).sum()
    return round(((promoters - detractors) / total) * 100)

df = pd.DataFrame({"segment": ["A", "A", "B", "B"], "score": [10, 6, 9, 8]})
print(df.groupby("segment")["score"].apply(nps_from_series))
Grouped NPS is more actionable than one site-wide number when the business has different products or customer journeys. If you are preparing structured tables before analysis, the guide on converting a table to first normal form may help.
Visualize NPS response groups
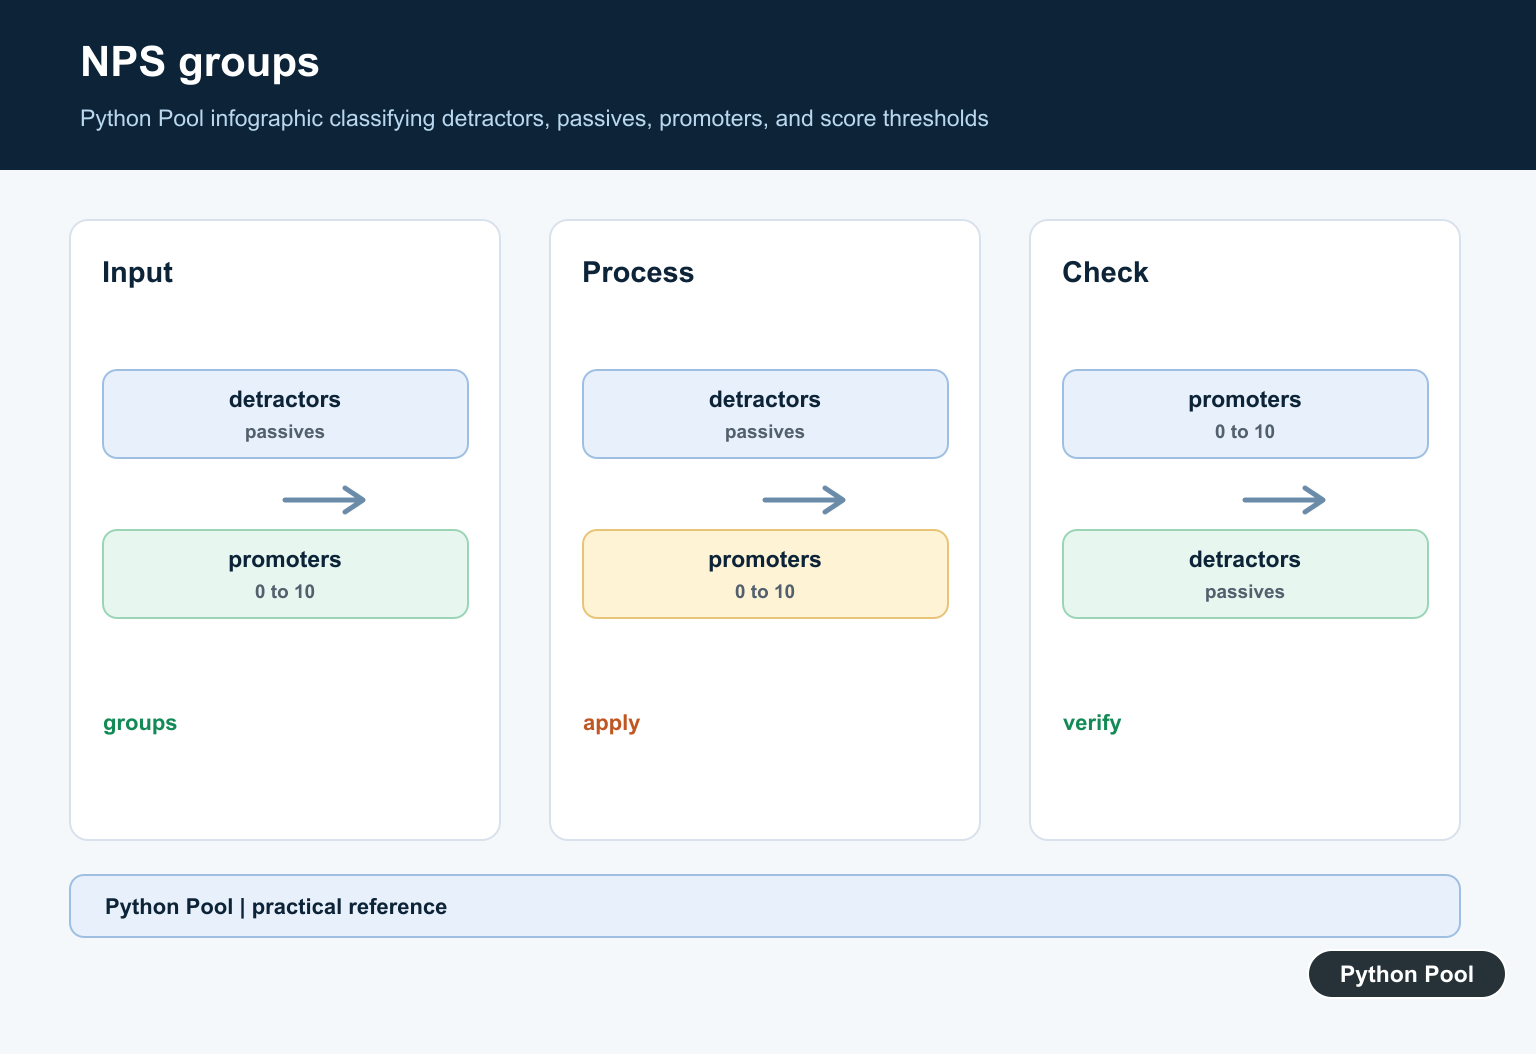
A simple bar chart can show the response mix before the final score. Plot the counts for promoters, passives, and detractors so readers can see the distribution.
import matplotlib.pyplot as plt

labels = ["promoters", "passives", "detractors"]
counts = [4, 3, 3]
colors = ["#2d7667", "#bf7b22", "#b94a4a"]

plt.bar(labels, counts, color=colors)
plt.title("NPS response groups")
plt.ylabel("responses")
plt.show()
Use the chart to support the metric, not replace it. The final NPS number is compact, while the response distribution explains what changed. For more charting options, see Matplotlib pie chart and the broader Python data visualization guide.
Report NPS responsibly
When reporting NPS, include the response count, date range, and segment definition. A score from 20 responses should not be treated the same as a score from thousands of responses, and trends are usually more useful than a single isolated number.
NPS also should not be the only customer metric in a report. Pair it with response comments, support themes, retention metrics, or follow-up survey answers. Python can calculate the score quickly, but the business decision still depends on context.
Classify The Responses
Use the standard buckets: detractors are 0 through 6, passives are 7 or 8, and promoters are 9 or 10. Reject values outside zero through ten rather than silently assigning them.
Use The Valid Denominator
NPS is calculated from valid responses. Missing, malformed, or out-of-range answers should be excluded according to a documented rule, and the report should show how many responses remained.
Report Percentage Points
A score of 25 means promoters exceed detractors by 25 percentage points; it is not the percentage of respondents who are promoters. Keep the range and rounding policy visible.
Preserve Segments Carefully
If NPS is reported by month, product, or customer group, apply the same classification and missing-data policy to every segment. Small samples can produce unstable scores even when the arithmetic is correct.
Test Boundary Scores
Test 0, 6, 7, 8, 9, and 10 explicitly, along with an empty valid set and invalid inputs. These boundaries catch off-by-one errors that can materially change a report.
The bucket definitions follow the Net Promoter System methodology. Related references include statistics, data filtering, and boundary tests.
For related measurement workflows, compare variance, data filtering, and boundary tests when reporting NPS segments.
For the authoritative API and current behavior, consult the Python statistics documentation.
Frequently Asked Questions
How is NPS calculated?
NPS equals the percentage of promoters scoring 9 or 10 minus the percentage of detractors scoring 0 through 6.
Where do passives go in NPS?
Passives scoring 7 or 8 are not added to either group, but their responses remain in the denominator.
Can NPS range from negative to positive?
Yes. The usual range is -100 to 100, expressed in percentage points rather than a percentage of one group.
How should missing NPS responses be handled?
Exclude missing or invalid responses from the valid-response denominator and report the response count and rule.
