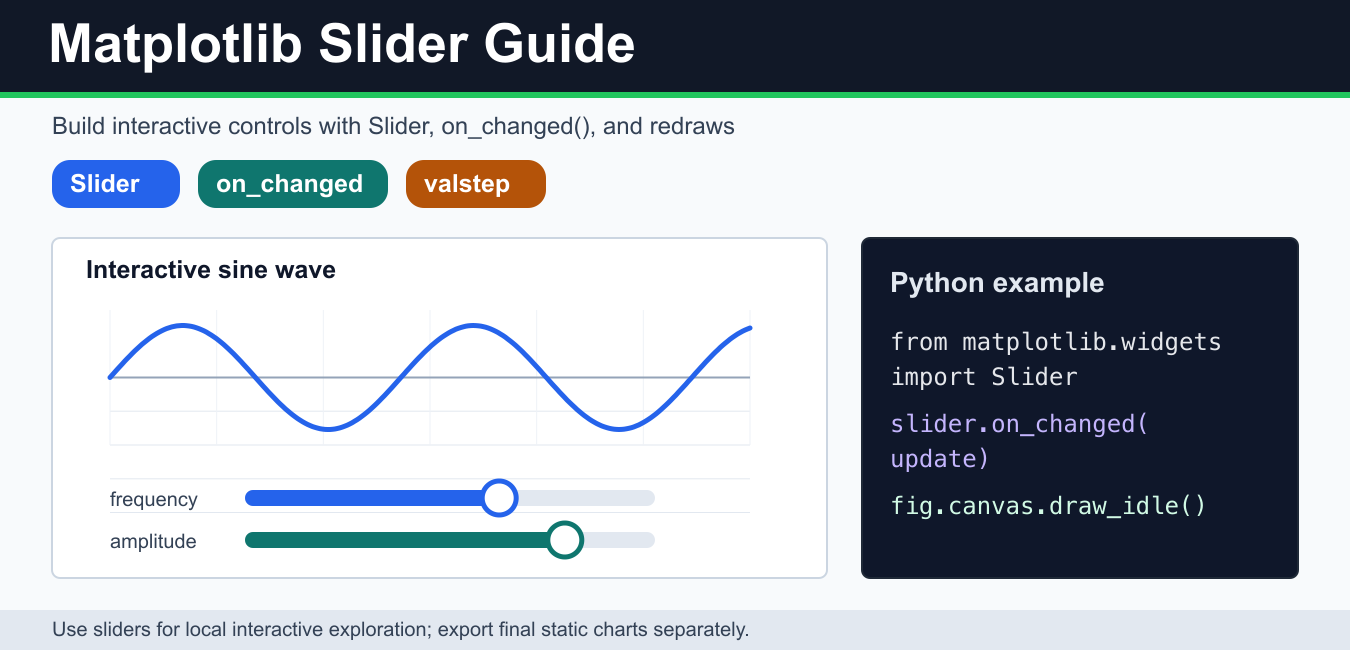
Quick answer: A Matplotlib Slider is a widget that emits a numeric value to a callback. Create a small axes for the control, update the plotted artist inside the callback, redraw the canvas, and keep the Slider object alive while the figure is interactive.
A Matplotlib Slider is an interactive widget that lets you change a plot by dragging a control. It is useful for exploring parameters such as frequency, amplitude, threshold, zoom level, filter strength, or model settings. The main class is matplotlib.widgets.Slider, and the usual pattern is to create a plot, create a small axes area for the slider, connect an on_changed() callback, and redraw the figure.
Sliders are best for local exploration in notebooks or desktop windows. They are not a replacement for a deployed web dashboard. If you need a shareable dashboard, tools such as Dash, Streamlit, or Plotly may be a better fit. PythonPool’s Python visualizer guide covers broader visualization options.
Basic Matplotlib Slider example
The example below uses a slider to control the frequency of a sine wave. Notice the extra bottom space from subplots_adjust(); without that, the slider can overlap the plot. The callback updates the line data and then calls fig.canvas.draw_idle() so Matplotlib redraws efficiently.
import numpy as np
import matplotlib.pyplot as plt
from matplotlib.widgets import Slider

x = np.linspace(0, 2 * np.pi, 400)
initial_frequency = 1

fig, ax = plt.subplots()
fig.subplots_adjust(bottom=0.25)
line, = ax.plot(x, np.sin(initial_frequency * x), linewidth=2)
ax.set_title("Sine wave frequency")

slider_ax = fig.add_axes([0.2, 0.08, 0.65, 0.03])
frequency_slider = Slider(
    ax=slider_ax,
    label="Frequency",
    valmin=0.5,
    valmax=5,
    valinit=initial_frequency,
)

def update(value):
    line.set_ydata(np.sin(value * x))
    fig.canvas.draw_idle()

frequency_slider.on_changed(update)
plt.show()
If the slider crowds the chart, adjust the layout deliberately. The Matplotlib subplot spacing guide covers subplots_adjust(), tight_layout(), and related layout fixes.
Use valstep for discrete slider values
Use valstep when the slider should move in fixed steps. This is useful for frame numbers, integer thresholds, sample counts, or any setting where fractional values do not make sense.
import numpy as np
import matplotlib.pyplot as plt
from matplotlib.widgets import Slider

x = np.linspace(0, 10, 200)
fig, ax = plt.subplots()
fig.subplots_adjust(bottom=0.25)
line, = ax.plot(x, np.sin(x))

slider_ax = fig.add_axes([0.2, 0.08, 0.65, 0.03])
step_slider = Slider(slider_ax, "Multiplier", 1, 10, valinit=1, valstep=1)

def update(multiplier):
    line.set_ydata(np.sin(multiplier * x))
    fig.canvas.draw_idle()

step_slider.on_changed(update)
plt.show()
Change line color with a slider
A slider callback can update more than the y-values. It can change color, line width, axis limits, labels, or other artist properties. In this example, the slider changes line width. For line style choices, see the Matplotlib linestyle guide; for point styling, see the Matplotlib marker guide.
import numpy as np
import matplotlib.pyplot as plt
from matplotlib.widgets import Slider

x = np.linspace(0, 2 * np.pi, 300)
fig, ax = plt.subplots()
fig.subplots_adjust(bottom=0.25)
line, = ax.plot(x, np.cos(x), linewidth=2)

slider_ax = fig.add_axes([0.2, 0.08, 0.65, 0.03])
width_slider = Slider(slider_ax, "Line width", 1, 8, valinit=2)

def update(width):
    line.set_linewidth(width)
    fig.canvas.draw_idle()

width_slider.on_changed(update)
plt.show()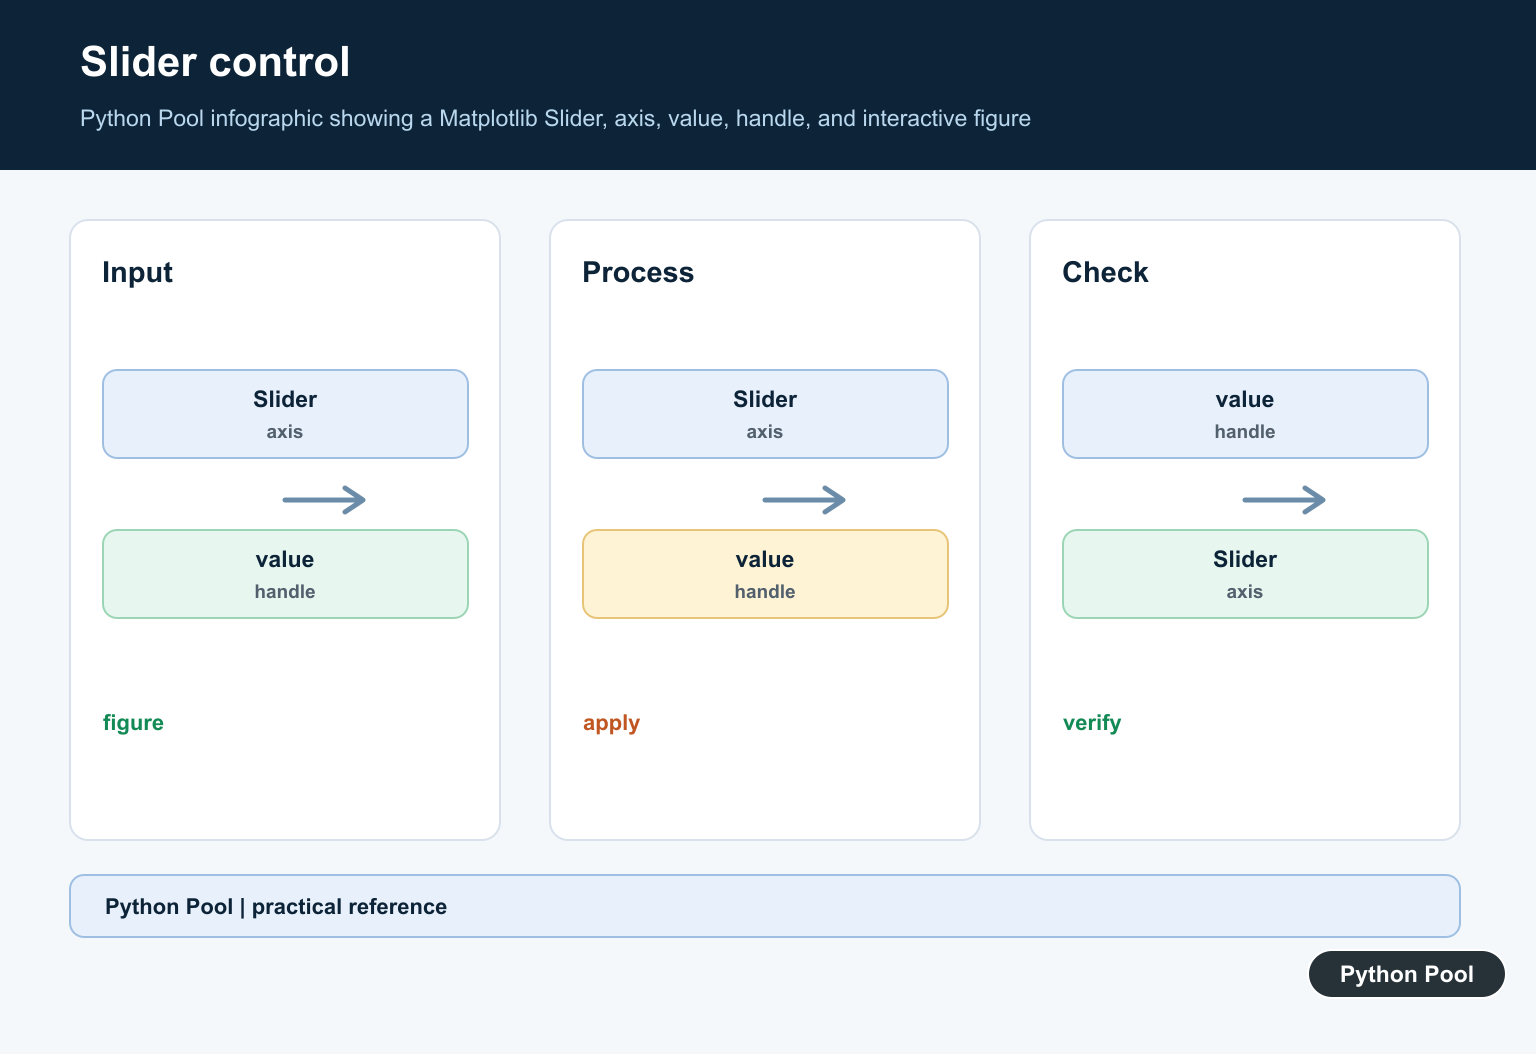
Zoom with a Matplotlib Slider
A slider can also control axis limits. The next example changes the visible y-range with set_ylim(). This is useful when you want to inspect a signal without regenerating the whole figure. If you only need fixed axis limits, the Matplotlib ylim guide is more direct.
import numpy as np
import matplotlib.pyplot as plt
from matplotlib.widgets import Slider

x = np.linspace(0, 20, 500)
y = np.sin(x) + 0.2 * np.sin(8 * x)

fig, ax = plt.subplots()
fig.subplots_adjust(bottom=0.25)
ax.plot(x, y)
ax.grid(True, alpha=0.3)

slider_ax = fig.add_axes([0.2, 0.08, 0.65, 0.03])
zoom_slider = Slider(slider_ax, "Y limit", 0.2, 2.0, valinit=1.2)

def update(limit):
    ax.set_ylim(-limit, limit)
    fig.canvas.draw_idle()

zoom_slider.on_changed(update)
plt.show()
Subtle grid lines help users read changing values without overpowering the data. The Matplotlib grid guide covers grid alpha, linestyle, and axis-specific settings.
Add a reset button
A reset button is useful when a plot has several controls. Matplotlib’s Button widget can call each slider’s reset() method. Keep a reference to the slider and button objects; otherwise, some interactive backends may garbage-collect the widget.
import numpy as np
import matplotlib.pyplot as plt
from matplotlib.widgets import Button, Slider

x = np.linspace(0, 2 * np.pi, 300)
fig, ax = plt.subplots()
fig.subplots_adjust(bottom=0.3)
line, = ax.plot(x, np.sin(x))

slider_ax = fig.add_axes([0.2, 0.12, 0.65, 0.03])
frequency_slider = Slider(slider_ax, "Frequency", 0.5, 5, valinit=1)

button_ax = fig.add_axes([0.8, 0.02, 0.12, 0.05])
reset_button = Button(button_ax, "Reset")

def update(value):
    line.set_ydata(np.sin(value * x))
    fig.canvas.draw_idle()

def reset(event):
    frequency_slider.reset()

frequency_slider.on_changed(update)
reset_button.on_clicked(reset)
plt.show()
Why a Matplotlib Slider may not work
- The widget object was not stored: keep variables such as
frequency_sliderandreset_buttonalive. - The backend is not interactive: static renderers cannot drag widgets.
- The callback does not redraw: call
fig.canvas.draw_idle()after changing artists. - The slider overlaps the plot: reserve space with
subplots_adjust()or a more deliberate layout. - The callback changes the wrong data: update the existing artist instead of creating a new line each time.
For interactive-session basics, see the Matplotlib ion guide. For labels and annotations that move with a chart, the Matplotlib text guide and Matplotlib annotate guide are useful companions.
Exporting slider plots
Slider widgets are interactive controls, not something that survives in a normal PNG export. If you need a static image, set the slider to the desired state and save the figure. If you need a shareable interactive experience, use a notebook, web dashboard, or HTML-oriented plotting library. For static output, use the Matplotlib savefig guide.
RangeSlider and backend notes
Use RangeSlider when the user needs to choose a lower and upper bound instead of one value. A common example is filtering a time window, selecting a data range, or controlling both ends of an axis limit. The callback receives a pair of values, so write the update function to unpack the lower and upper limit before redrawing the figure.
Matplotlib widgets also depend on an interactive backend. A script opened in a normal desktop window usually works, while a static image renderer cannot drag controls. In notebooks, make sure the environment supports interactive Matplotlib output. If a slider appears but does not move, check the backend first, then check that the widget object is stored in a live variable.
Official Matplotlib references
- Matplotlib slider demo
- matplotlib.widgets.Slider
- matplotlib.widgets.RangeSlider
- matplotlib.widgets.Button
- matplotlib.pyplot.subplots
- matplotlib.pyplot.axes
- Axes.set_ylim
Separate Widget And Plot Axes
The plot Axes displays data while a Slider needs its own control Axes. Reserve layout space for the widget so it does not overlap labels or the chart, and keep a reference to the Slider object for as long as the figure needs interaction.
Connect A Small Update Callback
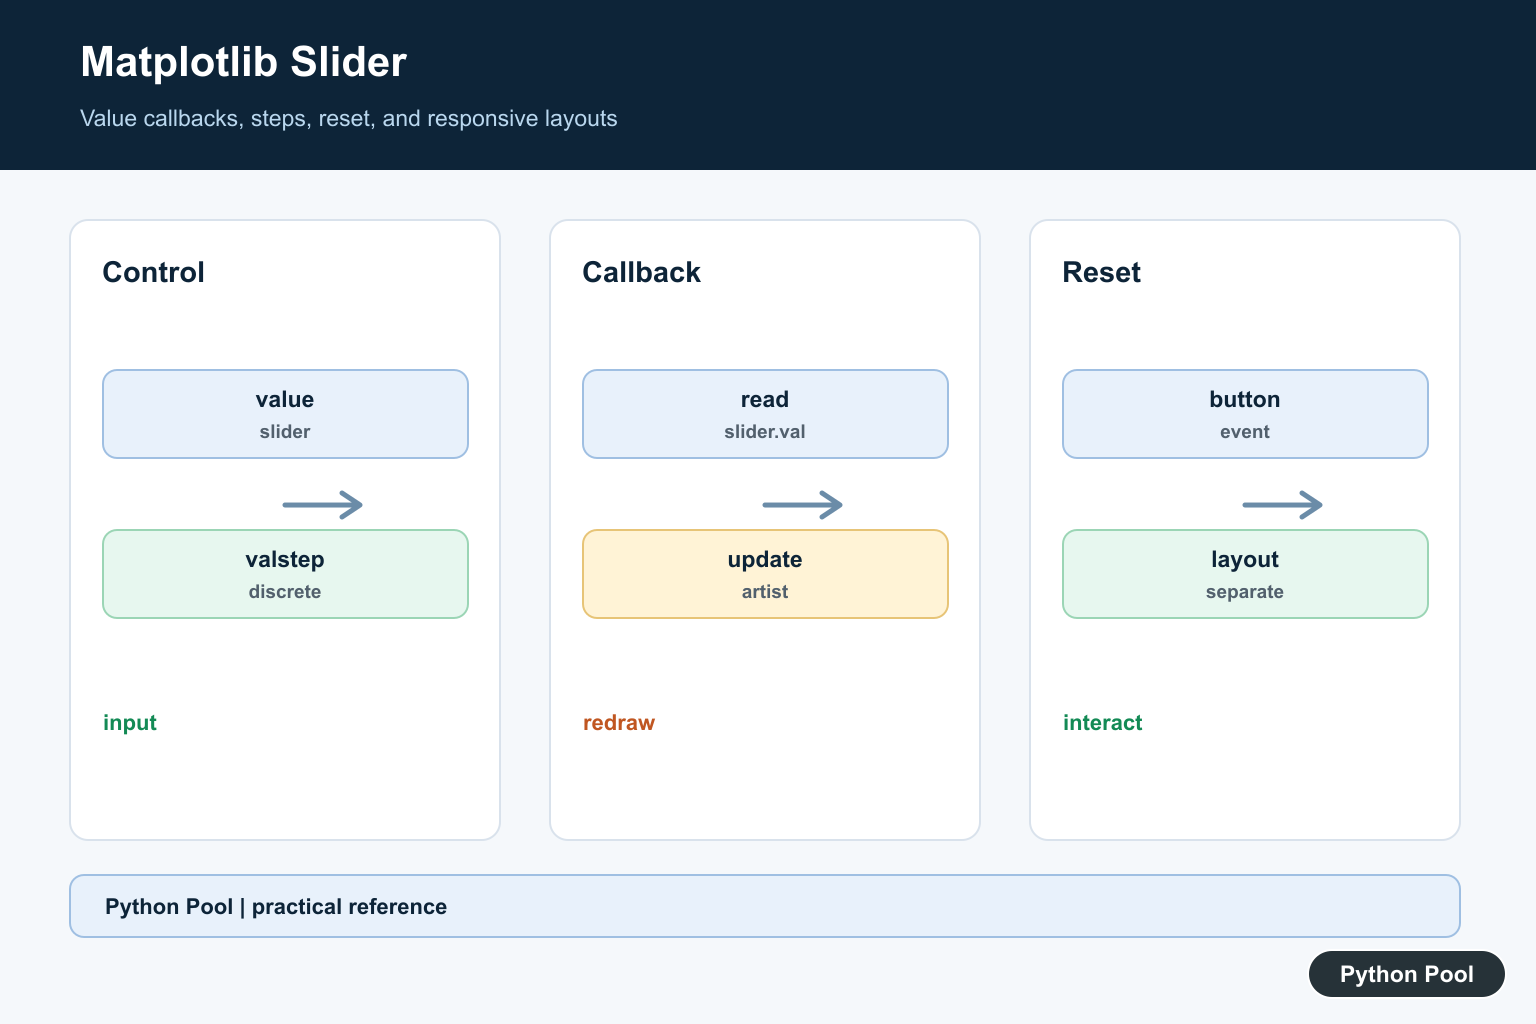
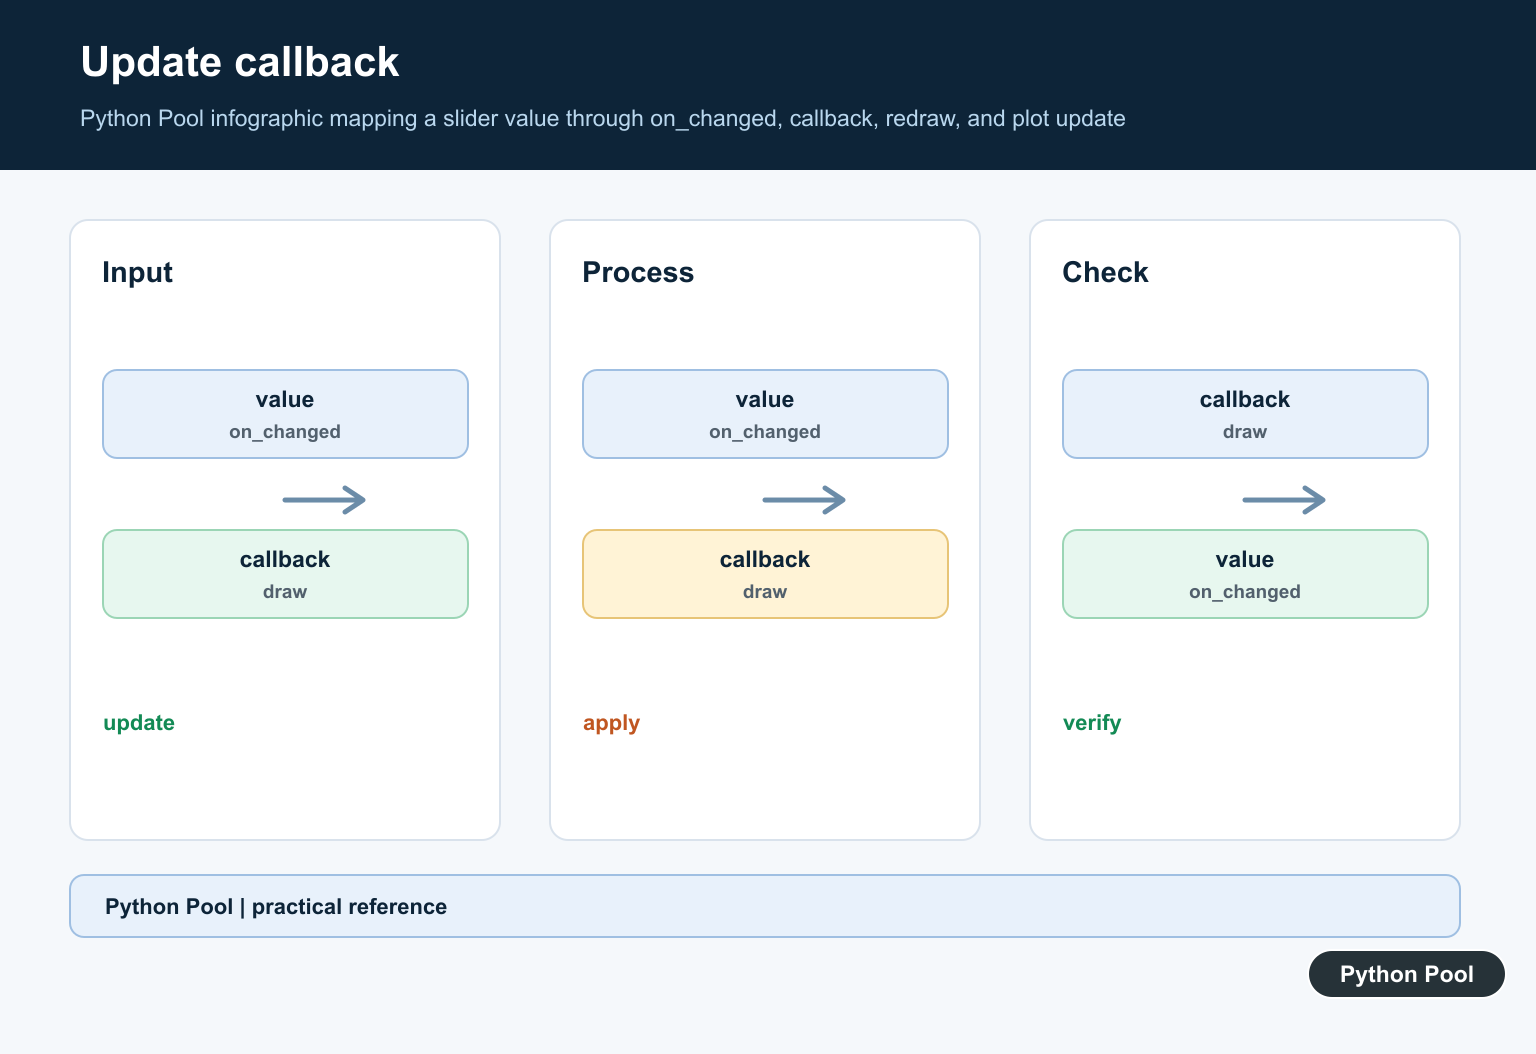
The callback should read slider.val, update an existing Line2D, image, or collection, and request a redraw. Updating the existing artist is usually clearer and cheaper than creating a new plot object for every slider event.
Use valstep For Discrete Values
A continuous slider is appropriate for a smooth parameter, while valstep can constrain values to a fixed increment or a sequence. Validate the range and map the displayed value to the data operation so rounding does not select an unintended index.
Add Reset And Multiple Controls
Keep initial values in one place and use a Button callback to restore the Slider and associated artists. With multiple controls, make each callback update only the state it owns or centralize state-to-plot rendering so controls cannot drift apart.
Check Backend And Export Behavior
Interactive widgets need a backend that supports events; a static image or non-interactive notebook backend may display the slider without responding. Save the final state deliberately and do not assume a widget remains interactive after export.
Test Values And Layout
Test minimum, maximum, step, reset, callback ordering, multiple controls, and a backend suitable for the target environment. Inspect the figure at the final size so the widget, labels, legend, and plot do not overlap.
The official Matplotlib widgets documentation and Slider reference define widget callbacks and valstep. Related guidance includes figure styling and interactive tests.
For related figure controls, compare surface styling, export behavior, and layout management when keeping an interactive chart readable.
Frequently Asked Questions
What is Matplotlib Slider used for?
matplotlib.widgets.Slider lets a user change a numeric value and call an update function that redraws a plot or artist.
How do I make a Slider use fixed increments?
Pass valstep with a scalar or sequence so the control emits discrete values rather than every possible continuous position.
Why does a Matplotlib Slider not respond?
The widget may be out of scope, the axes may overlap it, the backend may not be interactive, or the callback may not update and redraw the artist correctly.
How do I reset a Matplotlib Slider?
Keep the initial value and connect a Button callback that calls slider.reset() or restores the related plot state explicitly.
